Richland: Fire Incidents, Indiana (IN)
Where are fire incidents reported in Richland, IN
Something went wrong! Please refresh the page.
|
| |||||||||||||||||||||||||||||||||||||||||||||||||||||||||||||||||||||||||||||||||||||||||||||||||||||||||||||
2002 - 2017 National Fire Incident Reporting System (NFIRS) incidents
- Incident types reported to NFIRS in Richland, IN
- 24044.4%Fire
- 22641.9%Rescue & EMS
- 438.0%Hazardous Condition
- 234.3%Good Intent Call
- 40.7%Service Call
- 40.7%False Alarm
- Fire incident types reported to NFIRS in Richland, IN
- 11547.9%Outside Fires
- 9640.0%Structure Fires
- 2811.7%Mobile Property/Vehicle Fires
- 10.4%Other
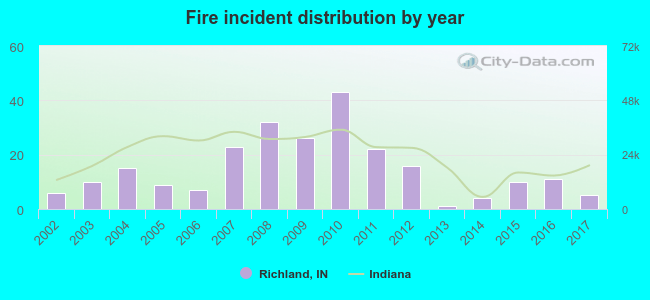 According to the data from the years 2002 - 2017 the average number of fires per year is 15. The highest number of fire incidents - 43 took place in 2010, and the least - 1 in 2013. The data has a dropping trend.
 30.0% incidents where reported in the morning and 70.0% in the evening. The most fires (18.3%) took place on Saturday, and the least (12.1%) on Wednesday.
 According to the 240 fire incidents from years 2002 - 2017 most fires (14.6%) took place during October, and the least (3.3%) in July.
 Out of all 540 cases reported during the years 2002 - 2017, the most belonged to the categories: Fire (44.4%), Overpressure Rupture (41.9%), and Rescue & EMS (8.0%).
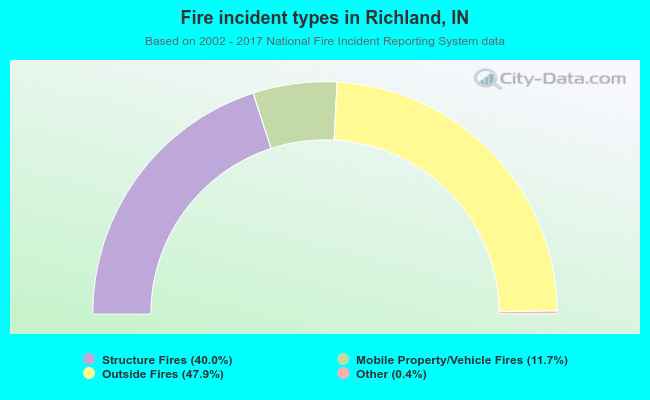 When looking into fire subcategories, the most incidents belonged to: Outside Fires (47.9%), and Structure Fires (40.0%).