Richmond: Fire Incidents, Massachusetts (MA)
Where are fire incidents reported in Richmond, MA
Something went wrong! Please refresh the page.
|
| |||||||||||||||||||||||||||||||||||||||||||||||||||||||||||||||||||||||||||||||||||||||||||||||||||||||||||||
2002 - 2018 National Fire Incident Reporting System (NFIRS) incidents
- Incident types reported to NFIRS in Richmond, MA
- 28934.4%Hazardous Condition
- 20023.8%Fire
- 15017.9%False Alarm
- 9911.8%Rescue & EMS
- 586.9%Service Call
- 344.1%Good Intent Call
- 91.1%Severe Weather
- Fire incident types reported to NFIRS in Richmond, MA
- 9045.0%Outside Fires
- 8743.5%Structure Fires
- 178.5%Mobile Property/Vehicle Fires
- 63.0%Other
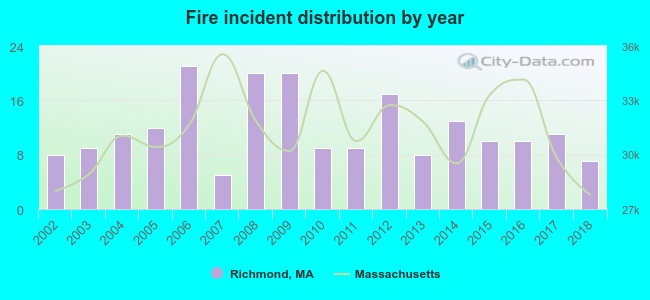 Based on the data from the years 2002 - 2018 the average number of fires per year is 12. The highest number of fires - 21 took place in 2006, and the least - 5 in 2007. The data has a declining trend.
 32.0% incidents where reported in the morning and 68.0% in the evening. The most fires (18.5%) took place on Sunday, and the least (9.0%) on Wednesday.
 Based on the 200 fire incidents from years 2002 - 2018 most fires (26.5%) took place during April, and the least (2.5%) in September.
 Out of all 839 cases reported during the years 2002 - 2018, the most belonged to the categories: Rescue & EMS (34.4%), Fire (23.8%), and Good Intent Call (17.9%).
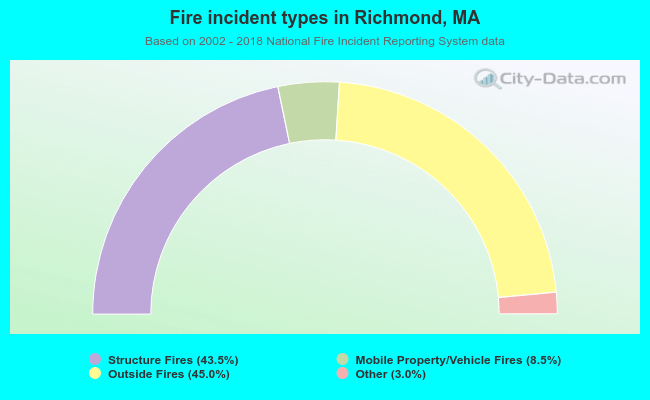 When looking into fire subcategories, the most reports belonged to: Outside Fires (45.0%), and Structure Fires (43.5%).