Richmond: Fire Incidents, Texas (TX)
Where are fire incidents reported in Richmond, TX
Something went wrong! Please refresh the page.
| Fire incidents reported | |
|---|---|
| Sreet name | Count |
| FM 359 | 142 |
| FM 762 | 130 |
| OLD SOUTH DR | 110 |
| FM 1640 | 80 |
| HWY 90-A | 78 |
| COLLINS RD | 72 |
| FM 2218 | 70 |
| ROCKY FALLS RD | 64 |
| MASON RD | 62 |
| HWY 99 | 58 |
| PLANTATION DR | 58 |
| PRESTON | 58 |
| FM 2977 | 54 |
| HARLEM RD | 50 |
| F.M. 359 | 44 |
| FM 1093 | 44 |
| JACKSON ST | 44 |
| F.M. 762 | 42 |
| POWERLINE RD | 42 |
| SKINNER LN | 42 |
| TORI RD | 40 |
| FM 1464 | 38 |
| MUSTANG DR | 38 |
| HWY 36 | 36 |
| PITTS RD | 36 |
| THOMPSON HWY | 36 |
| FM 723 | 34 |
| LAMAR DR | 34 |
| GOLFVIEW DR | 32 |
| HWY 59 | 32 |
| Other | 1,906 |
2002 - 2018 National Fire Incident Reporting System (NFIRS) incidents
- Incident types reported to NFIRS in Richmond, TX
- 16,10250.0%Rescue & EMS
- 4,03012.5%Hazardous Condition
- 3,60611.2%Fire
- 3,35810.4%Service Call
- 2,8198.8%False Alarm
- 1,7635.5%Good Intent Call
- 3451.1%Special Incident
- 1700.5%Severe Weather
- Fire incident types reported to NFIRS in Richmond, TX
- 1,60644.5%Outside Fires
- 1,37938.2%Structure Fires
- 51114.2%Mobile Property/Vehicle Fires
- 1103.1%Other
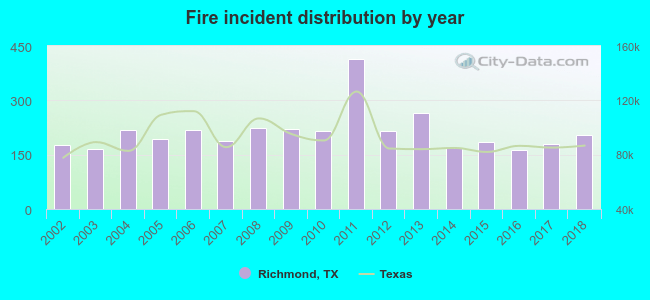 Based on the data from the years 2002 - 2018 the average number of fires per year is 212. The highest number of fire incidents - 414 took place in 2011, and the least - 163 in 2016. The data has a growing trend.
The average number of yearly fire incidents per 10k residents in Richmond, TX compared to nearest cities:
(Note: Based on data for the last 3 years, including only cities with population 5,000 and above)
| Richmond: | 151.4 |
| Rosenberg: | 59.4 |
| Sugar Land: | 18.3 |
| Meadows Place: | 2.9 |
| Stafford: | 75.0 |
| Missouri City: | 28.7 |
| Katy: | 260.2 |
| Fresno: | 16.6 |
| Bellaire: | 17.9 |
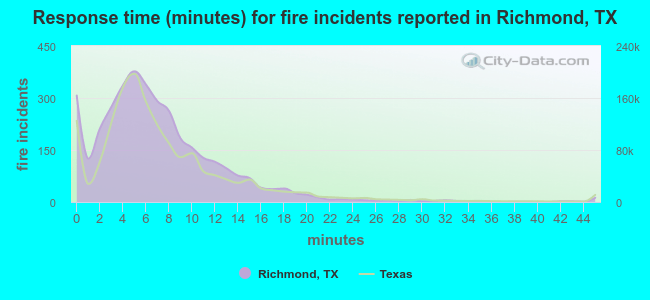 The median response time based on all reported fire incidents is 6 minutes. This is close to the Texas median value.
The median response time in Richmond, TX compared to nearest cities:
(Note: Based on data for all years, including only cities with at least 500 fire incidents)
| Richmond: | 6 minutes |
| Rosenberg: | 6 minutes |
| Sugar Land: | 6 minutes |
| Fulshear: | 9 minutes |
| Beasley: | 10 minutes |
| Stafford: | 7 minutes |
| Missouri City: | 7 minutes |
| Katy: | 8 minutes |
| Brookshire: | 9 minutes |
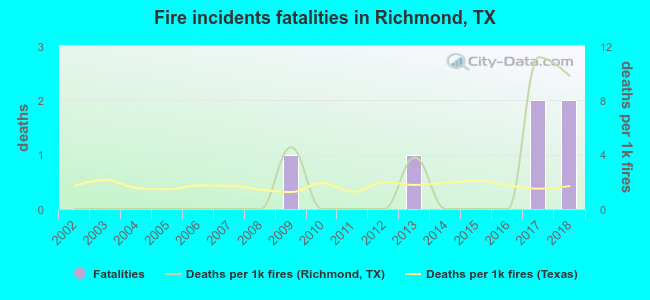 According to the data from the years 2002 - 2018 the average number of fire-related fatalities per year is 0. The highest number of reported deaths - 2 took place in 2017, and the lowest - 0 in 2002. The data has a rising trend.
The average number of deaths per 1,000 fires is 2. This indicator was the highest - 11 in 2017, and the lowest 0 in 2002. The trend for deaths per 1,000 fire incidents is increasing. Compared to the state value the number of fatalities per 1,000 fires is similar.
According to the data from the years 2002 - 2018 the average number of fire-related fatalities per year is 0. The highest number of reported deaths - 2 took place in 2017, and the lowest - 0 in 2002. The data has a rising trend.
The average number of deaths per 1,000 fires is 2. This indicator was the highest - 11 in 2017, and the lowest 0 in 2002. The trend for deaths per 1,000 fire incidents is increasing. Compared to the state value the number of fatalities per 1,000 fires is similar.Deaths per 1,000 incidents in Richmond, TX compared to nearest cities:
(Note: Based on data for all years, including only cities with at least 2,500 fire incidents)
| Richmond: | 1.7 |
| Rosenberg: | 0.6 |
| Sugar Land: | 3.2 |
| Missouri City: | 1.5 |
| Katy: | 3.3 |
| Houston: | 1.6 |
| Pearland: | 1.2 |
| Alvin: | 0.0 |
| Pasadena: | 1.3 |
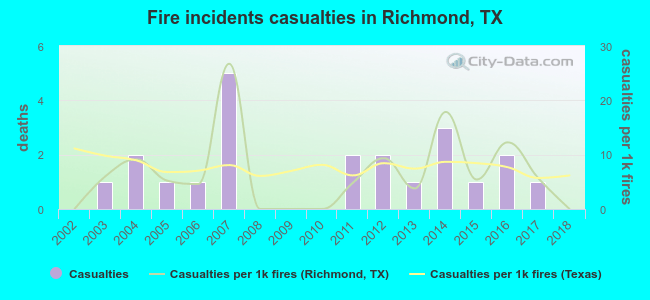 According to the data from the years 2002 - 2018 the average number of fire-related yearly casualties is 1. The highest number of injuries - 5 took place in 2007, and the lowest - 0 in 2002. The data has a constant trend.
The average number of injuries per 1,000 fires is 7. This indicator was the highest - 27 in 2007, and the lowest 0 in 2002. The trend for casualties per 1,000 incidents is constant. Compared to the state value the number of injuries per 1,000 incidents is lower.
According to the data from the years 2002 - 2018 the average number of fire-related yearly casualties is 1. The highest number of injuries - 5 took place in 2007, and the lowest - 0 in 2002. The data has a constant trend.
The average number of injuries per 1,000 fires is 7. This indicator was the highest - 27 in 2007, and the lowest 0 in 2002. The trend for casualties per 1,000 incidents is constant. Compared to the state value the number of injuries per 1,000 incidents is lower.Casualties per 1,000 incidents in Richmond, TX compared to nearest cities:
(Note: Based on data for all years, including only cities with at least 500 fire incidents)
| Richmond: | 6.1 |
| Rosenberg: | 10.6 |
| Sugar Land: | 6.4 |
| Fulshear: | 0.0 |
| Beasley: | 0.0 |
| Stafford: | 6.0 |
| Missouri City: | 15.7 |
| Katy: | 12.8 |
| Brookshire: | 1.6 |
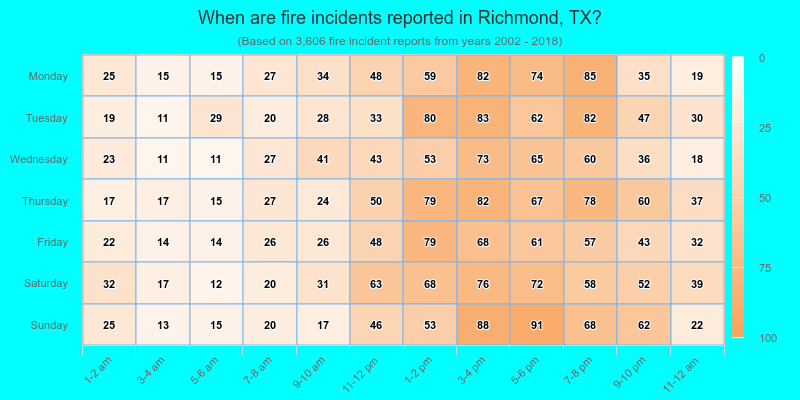
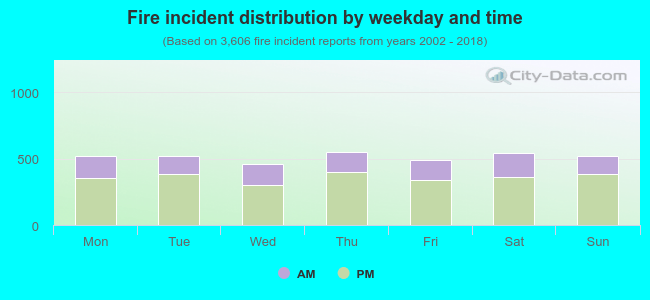 29.7% incidents where reported in the morning and 70.3% in the evening. The most fires (15.3%) took place on Thursday, and the least (12.8%) on Wednesday.
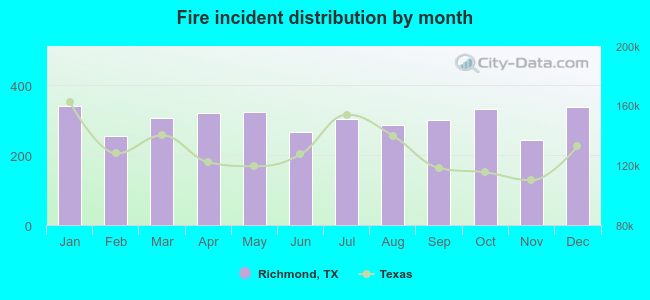 According to the 3,606 incident reports from years 2002 - 2018 most fires (9.5%) took place during January, and the least (6.8%) in November.
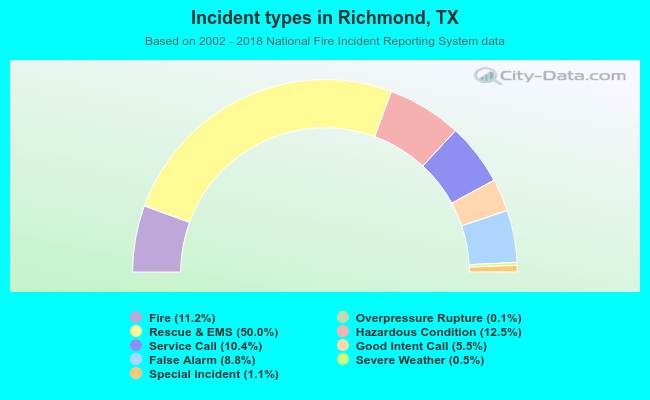 Out of all 32,212 cases reported during the years 2002 - 2018, the most belonged to the categories: Rescue & EMS (50.0%), Hazardous Condition (12.5%), and Fire (11.2%).
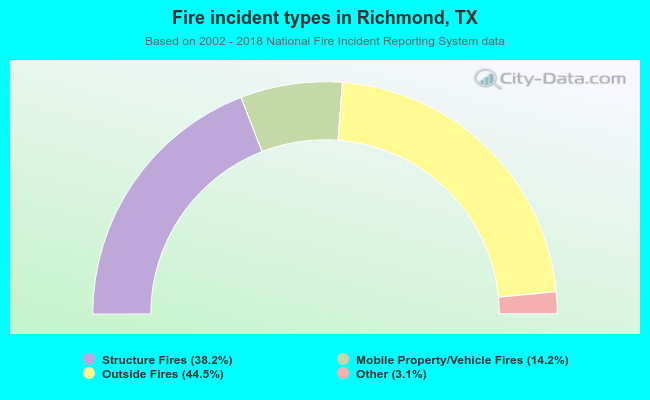 When looking into fire subcategories, the most incidents belonged to: Outside Fires (44.5%), and Structure Fires (38.2%).