Richwood: Fire Incidents, Louisiana (LA)
Where are fire incidents reported in Richwood, LA
Something went wrong! Please refresh the page.
|
| |||||||||||||||||||||||||||||||||||||||||||||||||||||||||||||||||||||||||||||||||||||||||
2002 - 2018 National Fire Incident Reporting System (NFIRS) incidents
- Incident types reported to NFIRS in Richwood, LA
- 44453.4%Rescue & EMS
- 15118.2%Fire
- 15018.1%Good Intent Call
- 435.2%Service Call
- 293.5%Hazardous Condition
- 141.7%False Alarm
- Fire incident types reported to NFIRS in Richwood, LA
- 6845.0%Structure Fires
- 6039.7%Outside Fires
- 2113.9%Mobile Property/Vehicle Fires
- 21.3%Other
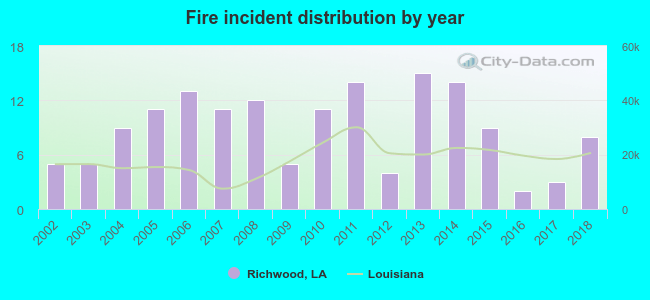 Based on the data from the years 2002 - 2018 the average number of fires per year is 9. The highest number of fires - 15 took place in 2013, and the least - 2 in 2016. The data has a growing trend.
 29.8% incidents where reported in the morning and 70.2% in the evening. The most fires (16.6%) took place on Friday, and the least (12.6%) on Tuesday.
 Based on the 151 reports from years 2002 - 2018 most fires (16.6%) took place during December, and the least (2.6%) in August.
 Out of all 831 cases reported during the years 2002 - 2018, the most belonged to the categories: Overpressure Rupture (53.4%), Fire (18.2%), and Service Call (18.1%).
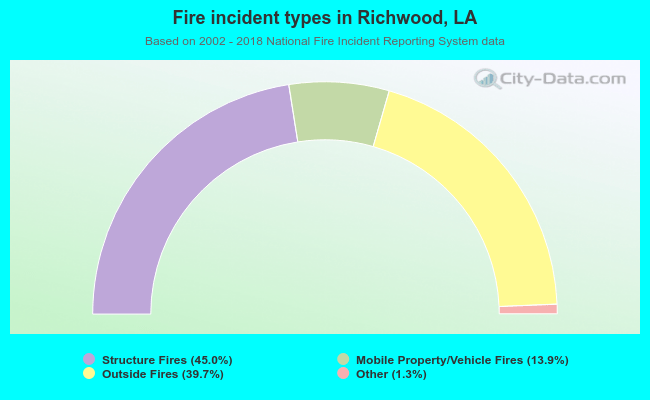 When looking into fire subcategories, the most incidents belonged to: Structure Fires (45.0%), and Outside Fires (39.7%).