| Fire incidents reported |
|---|
| Sreet name | Count |
|---|
| RICKMAN RD | 14 | | JUNE CHAPEL RD | 8 | | PARK RD | 6 | | RICKMAN MONTEREY HWY | 6 | | 115 STOCKTON LN | 4 | | 124 PARK RD | 4 | | 3234 RICKMAN RD. | 4 | | 805 RICKMAN MONTEREY HWY | 4 | | BETHLEHEM RD | 4 | | COOKEVILLE HWY | 4 | | RICKMAN MONTEREY HWY | 2 | | 101 OAK SPRING LN. | 2 | | 1015 OAKHILL RD | 2 | | 111 | 2 | | 112 PARK RD | 2 | | 115 MIDWAY SUBDIVISION LN | 2 | | 119 EAST WILMOTH ROAD | 2 | | 121 MIRAGE DRIVE | 2 | | 122 BRUCE LN | 2 | | 128 GRANDVIEW DR | 2 | | 130 PARK RD. | 2 | | 1309 OKOLONA RD | 2 | | 131 HILLTOP LN. | 2 | | 132 RICKMAN COMM CTR RD | 2 | | 132 RICKMAN MONTEREY HWY | 2 |
| | | Fire incidents reported |
|---|
| Sreet name | Count |
|---|
| 1412 RICKMAN MONTERAY HWY. | 2 | | 1512 OKOLONA RD | 2 | | 156 CURTIS NORROD RD | 2 | | 159 DAIL LANE | 2 | | 1601 RICKMAN MONTEREY HWY | 2 | | 163 OAK HILL CIRCLE | 2 | | 164 JUNE CHAPEL RD | 2 | | 170 RICKMAN MONTEREY RD | 2 | | 189 OAK HILL CIR. | 2 | | 192 YOUNG RD LGTS | 2 | | 200 EARNEST LOOPER | 2 | | 2060 IRIS LN | 2 | | 2149 IRIS LN | 2 | | 227 BRUCE LN | 2 | | 230 SHADOW LANE | 2 | | 240 BRUCE LN. | 2 | | 249 BRUCE LN | 2 | | 274 EAST WILMOUTH | 2 | | 287 OLD THONPSON LN. | 2 | | 293 ERNEST LOOPER | 2 | | 309 YOUNG RD | 2 | | 3207 COOKEVILLE HWY | 2 | | 3258 RICKMAN RD. | 2 | | 3280 COOKVILLE HWY | 2 | | |
|
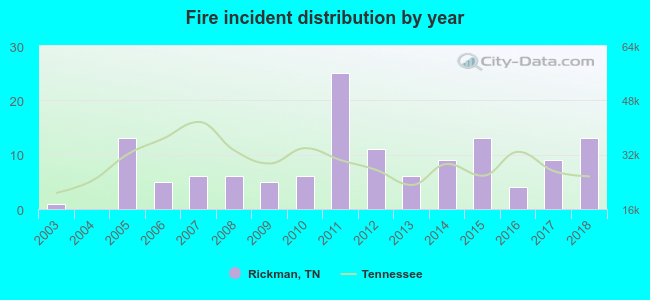 According to the data from the years 2003 - 2018 the average number of fire incidents per year is 8. The highest number of fire incidents - 25 took place in 2011, and the least - 0 in 2004. The data has a rising trend.
 24.2% incidents where reported in the morning and 75.8% in the evening. The most fires (20.5%) took place on Friday, and the least (10.6%) on Tuesday.
 Based on the 132 reports from years 2003 - 2018 most fires (16.7%) took place during February, and the least (3.8%) in June.
 Out of all 240 cases reported during the years 2003 - 2018, the most belonged to the categories: Fire (55.0%), Hazardous Condition (17.1%), and Rescue & EMS (12.5%).
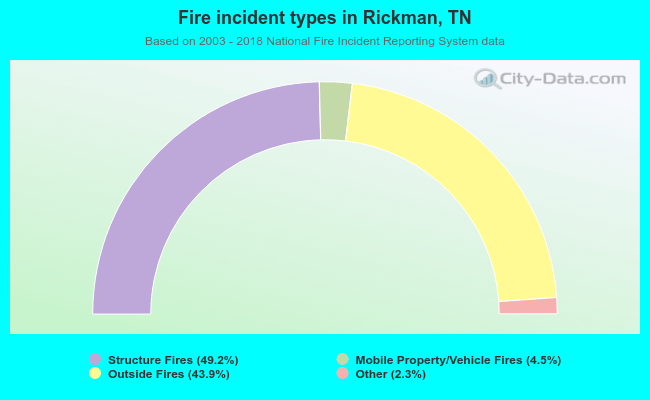 When looking into fire subcategories, the most reports belonged to: Structure Fires (49.2%), and Outside Fires (43.9%).