| Fire incidents reported |
|---|
| Sreet name | Count |
|---|
| 412 | 40 | | 58 | 38 | | COUNTY RD | 10 | | AMES BT | 8 | | MAIN ST | 8 | | STATE HIGHWAY 58 | 8 | | 41258 JUNCTION | 6 | | COUNTY ROAD 263 | 6 | | COUNTY ROAD 47 | 6 | | HIGHLINE RD | 6 | | STATE HIGHWAY 412 LGTS | 6 | | COUNTY ROAD | 4 | | COUNTY ROAD 264 | 4 | | COUNTY ROAD 265 | 4 | | COUNTY ROAD 266 | 4 | | COUNTY ROAD 269 | 4 | | COUNTY ROAD 44 | 4 | | HIGHWAY 412 | 4 | | HWY 58 | 4 | | STATE HIGHWAY 412 | 4 | | US 412 | 4 | | US412 | 4 | | W OF SCHOOL | 4 | | YOLO RANCH | 4 | | 1 E 35 N OF MENO COUNTY | 2 |
| | | Fire incidents reported |
|---|
| Sreet name | Count |
|---|
| 1 N 9 MI CORNER | 2 | | 115 E 4TH | 2 | | 11TH STREET | 2 | | 14 SOUTH OF 41258 | 2 | | 2 1/2 MILES NORTH OF RINGWOOD | 2 | | 200 S. MAIN | 2 | | 200 W HIGHLINE RD | 2 | | 210 1/2 N. MAPLE | 2 | | 210 N. OAK | 2 | | 2MILES SOUTH 2MILES WEST MENO | 2 | | 3 MILE N OF HWY 8/58 JCT 1.5 N | 2 | | 3 WEST OF RINGWOOD OK | 2 | | 4 S, 2 1/2 E OF RINGWOOD | 2 | | 4 W ON 412 | 2 | | 412 58 | 2 | | 412 HWY | 2 | | 4MILES SOUTH 1 3/8 WEST | 2 | | 5 W 4 NOF RINGWOOD | 2 | | 58 AND 12 STREET | 2 | | 58 AND 412 | 2 | | 6 S OF POST OFFICE25 E | 2 | | 6W1N RINGWOOD | 2 | | 7 S OF RINGWOOD, 1.5 W | 2 | | 702 E. CEDAR LANE | 2 | | |
|
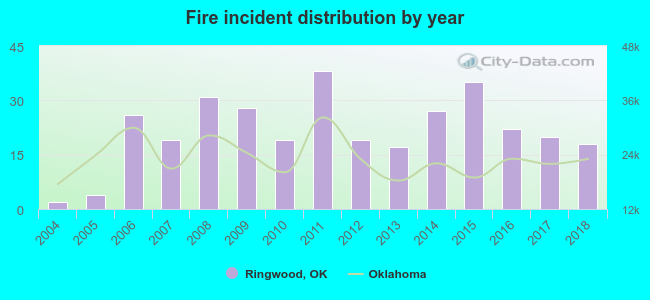 Based on the data from the years 2004 - 2018 the average number of fires per year is 22. The highest number of reported fires - 38 took place in 2011, and the least - 2 in 2004. The data has a rising trend.
 18.5% incidents where reported in the morning and 81.5% in the evening. The most fires (16.9%) took place on Saturday, and the least (11.7%) on Sunday.
 According to the 325 fire incidents from years 2004 - 2018 most fires (16.0%) took place during March, and the least (4.0%) in November.
 Out of all 563 cases reported during the years 2004 - 2018, the most belonged to the categories: Fire (57.7%), Overpressure Rupture (26.1%), and Rescue & EMS (5.7%).
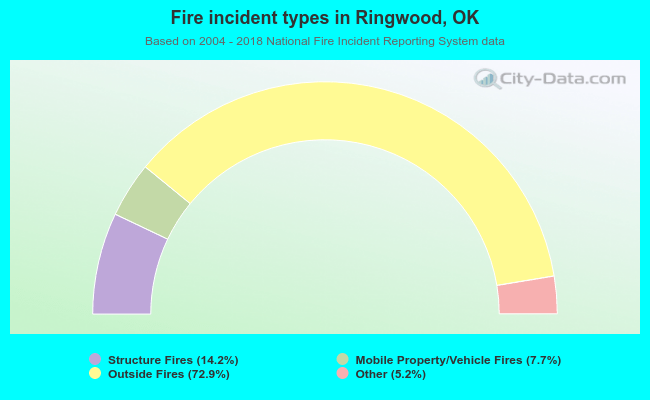 When looking into fire subcategories, the most incidents belonged to: Outside Fires (72.9%), and Structure Fires (14.2%).