Riverdale: Fire Incidents, New Jersey (NJ)
Where are fire incidents reported in Riverdale, NJ
Something went wrong! Please refresh the page.
|
| |||||||||||||||||||||||||||||||||||||||||||||||||||||||||||||||||||||||||||||||||||||||||||||||||||||||||||||
2002 - 2018 National Fire Incident Reporting System (NFIRS) incidents
- Incident types reported to NFIRS in Riverdale, NJ
- 72744.8%Hazardous Condition
- 31819.6%Fire
- 29718.3%False Alarm
- 1137.0%Service Call
- 915.6%Good Intent Call
- 734.5%Rescue & EMS
- 20.1%Overpressure Rupture
- Fire incident types reported to NFIRS in Riverdale, NJ
- 11134.9%Structure Fires
- 10733.6%Outside Fires
- 9028.3%Mobile Property/Vehicle Fires
- 103.1%Other
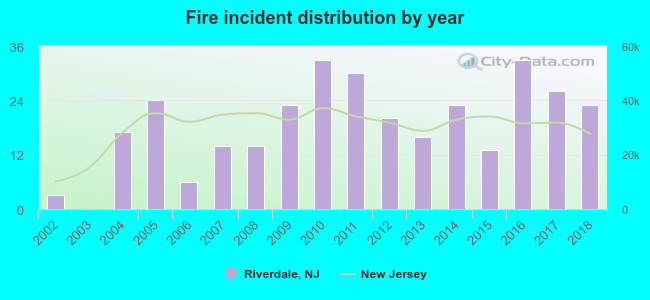 According to the data from the years 2002 - 2018 the average number of fires per year is 19. The highest number of reported fires - 33 took place in 2010, and the least - 0 in 2003. The data has an increasing trend.
 30.2% incidents where reported in the morning and 69.8% in the evening. The most fires (17.3%) took place on Thursday, and the least (11.6%) on Monday.
 Based on the 318 fire incident reports from years 2002 - 2018 most fires (12.6%) took place during June, and the least (3.5%) in October.
 Out of all 1,622 cases reported during the years 2002 - 2018, the most belonged to the categories: Hazardous Condition (44.8%), Fire (19.6%), and False Alarm (18.3%).
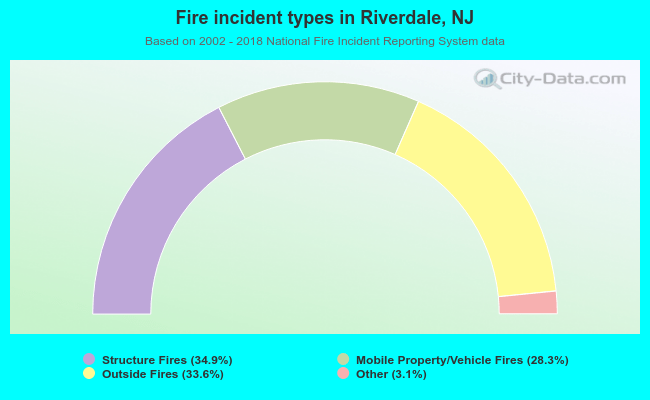 When looking into fire subcategories, the most reports belonged to: Structure Fires (34.9%), and Outside Fires (33.6%).