| Fire incidents reported |
|---|
| Sreet name | Count |
|---|
| FM 980 | 20 | | HWY 19 | 10 | | FM 405 | 8 | | HWY. 19 | 6 | | WOOD FARM RD | 6 | | 13 RAINBOW DR. | 4 | | 19 | 4 | | 980 | 4 | | HWY 19 @ 405 | 4 | | HWY 19 NORTH | 4 | | KNOX CIRCLE CIR | 4 | | LAKE SHORE LANE LN | 4 | | PALSIADE CIRCLE #33 | 4 | | SH 19 | 4 | | SUNRISE LOOP | 4 | | #9 HILL STREET | 2 | | 101 HORESHOE LAKE DR | 2 | | 101 HORSE SHOE LAKE DR. | 2 | | 101 HORSESHOE LAKE | 2 | | 108 OATS BROTHERS RD | 2 | | 11 A SOUTH WALLNUT DR. | 2 | | 11 PINE KNOT SQUARE | 2 | | 11 RAINBOW DR | 2 | | 110 HILLTOP LN. | 2 | | 113 HORSESHOE LAKE DR. | 2 |
| | | Fire incidents reported |
|---|
| Sreet name | Count |
|---|
| 119 LAKE RD. | 2 | | 1245 FM 405 | 2 | | 13 NORTHFOLK RD | 2 | | 1300 BLK 405 | 2 | | 14 MARINA POINT DR. | 2 | | 14 RAINBOW RD. | 2 | | 15 RAINBOW | 2 | | 166 LAKELAND DR | 2 | | 17 KOHEL RD | 2 | | 17 MICHEAL RD | 2 | | 17 TIMBERLINE CIRCLE | 2 | | 19 WOOD FARM RD. | 2 | | 1B HAYNES RD | 2 | | 2 MARS DR. | 2 | | 214 NOCIS LN. | 2 | | 2157 FM 980 | 2 | | 22 MARS LN. | 2 | | 2400 BK. OF FM. 980 | 2 | | 2422 FM 980 | 2 | | 2426 FM 980 ( JOHNSON RD.) | 2 | | 25 HILL ST | 2 | | 25 JOHNSON ST. | 2 | | 2500 FM 980 EAST | 2 | | 2866 & HWY 19 | 2 | | |
|
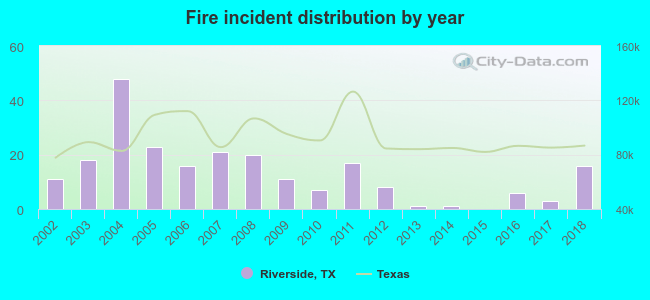 According to the data from the years 2002 - 2018 the average number of fire incidents per year is 13. The highest number of fire incidents - 48 took place in 2004, and the least - 0 in 2015. The data has a rising trend.
 25.6% incidents where reported in the morning and 74.4% in the evening. The most fires (17.6%) took place on Sunday, and the least (11.0%) on Thursday.
 According to the 227 reports from years 2002 - 2018 most fires (15.9%) took place during January, and the least (5.3%) in May.
 Out of all 683 cases reported during the years 2002 - 2018, the most belonged to the categories: Rescue & EMS (43.8%), Fire (33.2%), and Good Intent Call (10.2%).
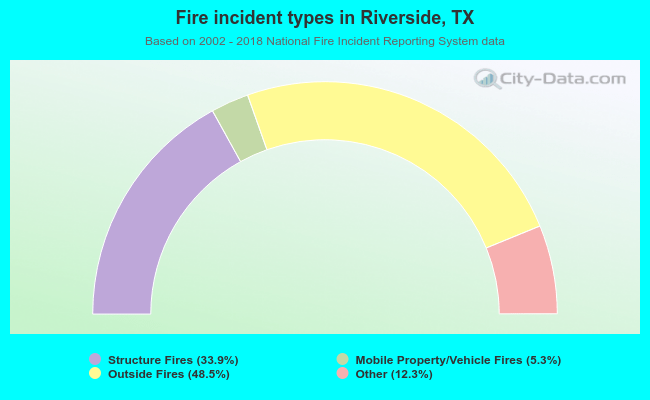 When looking into fire subcategories, the most reports belonged to: Outside Fires (48.5%), and Structure Fires (33.9%).