Roachdale: Fire Incidents, Indiana (IN)
Where are fire incidents reported in Roachdale, IN
Something went wrong! Please refresh the page.
|
| |||||||||||||||||||||||||||||||||||||||||||||||||||||||||||||||||||||||||||||||||||||||||||||||||||||||||||||
2002 - 2018 National Fire Incident Reporting System (NFIRS) incidents
- Incident types reported to NFIRS in Roachdale, IN
- 26045.1%Fire
- 14625.3%Hazardous Condition
- 5810.1%Rescue & EMS
- 478.1%Good Intent Call
- 417.1%Service Call
- 183.1%False Alarm
- 50.9%Special Incident
- 10.2%Overpressure Rupture
- 10.2%Severe Weather
- Fire incident types reported to NFIRS in Roachdale, IN
- 11343.5%Structure Fires
- 10841.5%Outside Fires
- 259.6%Mobile Property/Vehicle Fires
- 145.4%Other
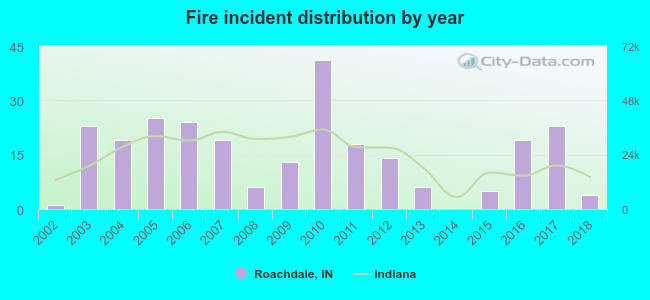 According to the data from the years 2002 - 2018 the average number of fires per year is 15. The highest number of fire incidents - 41 took place in 2010, and the least - 0 in 2014. The data has a growing trend.
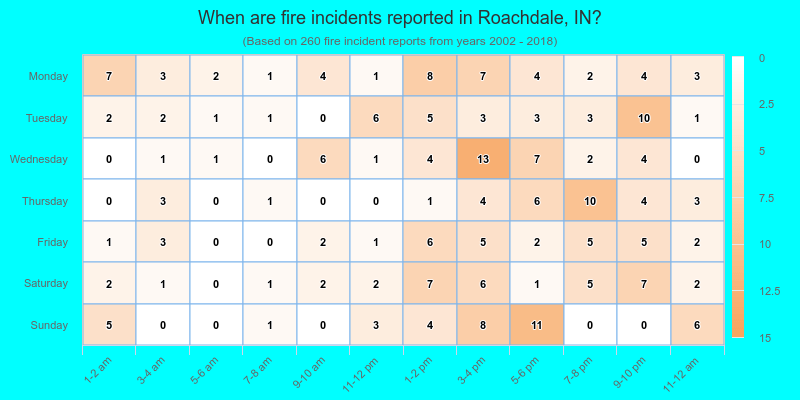
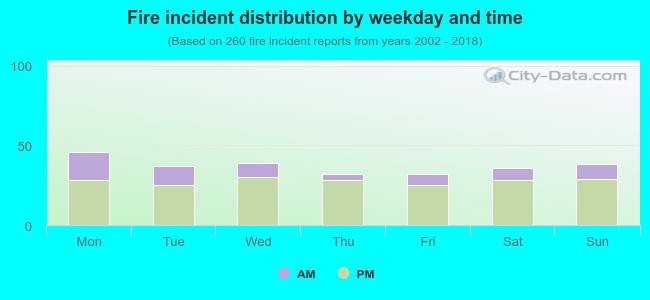 25.8% incidents where reported in the morning and 74.2% in the evening. The most fires (17.7%) took place on Monday, and the least (12.3%) on Thursday.
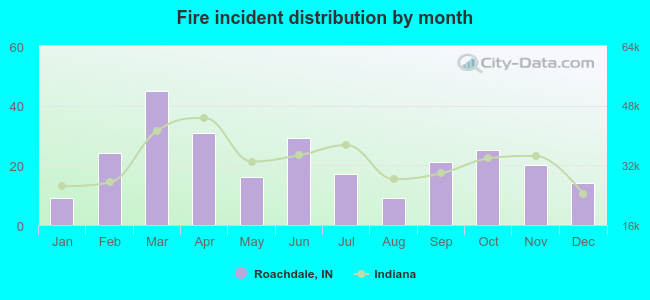 According to the 260 fire incidents from years 2002 - 2018 most fires (17.3%) took place during March, and the least (3.5%) in January.
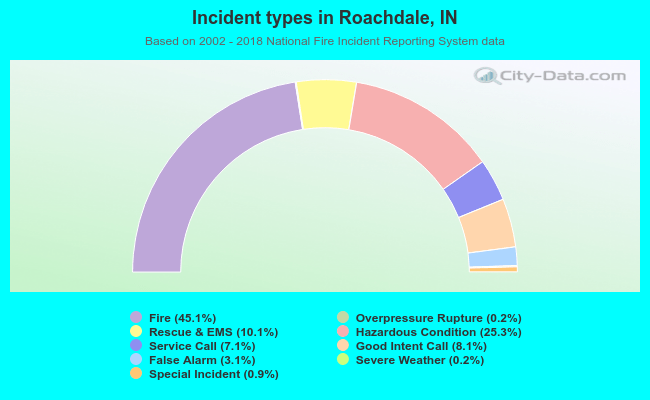 Out of all 577 cases reported during the years 2002 - 2018, the most belonged to the categories: Fire (45.1%), Hazardous Condition (25.3%), and Rescue & EMS (10.1%).
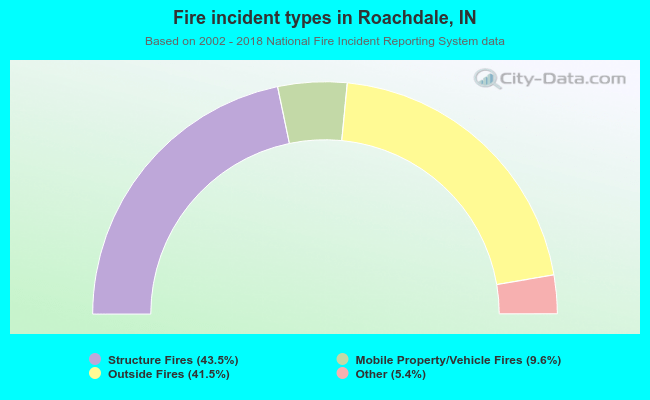 When looking into fire subcategories, the most incidents belonged to: Structure Fires (43.5%), and Outside Fires (41.5%).