| Fire incidents reported |
|---|
| Sreet name | Count |
|---|
| NYDECK RD | 18 | | BREWSTERTOWN RD | 16 | | SCOTT HWY | 10 | | RUGBY HWY | 8 | | CONCORD RD. | 6 | | SHIRLEY FORD RD | 6 | | WEST ROBBINS RD | 6 | | 1190 MTN VIEW RD | 4 | | 2990 WEST ROBBINS RD. | 4 | | 396 CONCORD RD. | 4 | | BRIMSTONE RD | 4 | | MOUNTAIN VIEW RD | 4 | | OLD RUGBY PIKE | 4 | | WHITE OAK CREEK LN | 4 | | WOLF CREEK RD. | 4 | | 10 SCOTT HWY. HWY | 2 | | 1032 GRASSY KNOB RD. | 2 | | 1065 NYDECK TRAIL | 2 | | 113 YOUNG RD. | 2 | | 125 RED HILL RD. | 2 | | 125 SYCAMORE LANE | 2 | | 13131 BRIMSTONE RD. | 2 | | 132 GRASSY KNOB RD. | 2 | | 1417 NYDECK TRAIL | 2 | | 1418 BRIMSTONE RD. | 2 |
| | | Fire incidents reported |
|---|
| Sreet name | Count |
|---|
| 142 SHEPARD LANE | 2 | | 1500 COAL HILL RD | 2 | | 1537 MT. VIEW RD. | 2 | | 1541 BLACK CREEK RD. | 2 | | 1675 BRIMSTONE RD. | 2 | | 1930 WEST ROBBINS ROAD RD | 2 | | 206 COAL HILL RD. | 2 | | 2085 SCOTT HWY. | 2 | | 209 COAL HILL RD. | 2 | | 2105 BRIMSTONE ROAD | 2 | | 211 OLD SCHOOL HOUSE RD. | 2 | | 2147 OLD HIGHWAY #27 | 2 | | 220 OLD RUGBY SCHOOL HOUSE RD. | 2 | | 228 WHITE OAK CIRCLE RD | 2 | | 233 NYDECK RD. | 2 | | 2350 OLD HWY. 27 | 2 | | 2417 MTN. VIEW RD. | 2 | | 2500 SCOTT HWY | 2 | | 261 SEXTON ROAD | 2 | | 2619 RIDGE RD. | 2 | | 286 DOGWOOD LN. LN | 2 | | 2934 BRIMSTONE RD. RD | 2 | | 2940 WOLF CREEK RD. RD | 2 | | 30 TUNNEL HILL RD. | 2 | | |
|
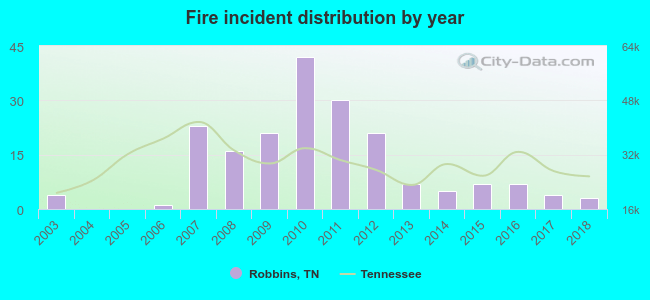 According to the data from the years 2003 - 2018 the average number of fires per year is 12. The highest number of reported fires - 42 took place in 2010, and the least - 0 in 2004. The data has a dropping trend.
 33.5% incidents where reported in the morning and 66.5% in the evening. The most fires (19.9%) took place on Monday, and the least (10.5%) on Thursday.
 Based on the 191 reports from years 2003 - 2018 most fires (13.6%) took place during March, and the least (3.1%) in May.
 Out of all 240 cases reported during the years 2003 - 2018, the most belonged to the categories: Fire (79.6%), Rescue & EMS (6.7%), and Service Call (6.7%).
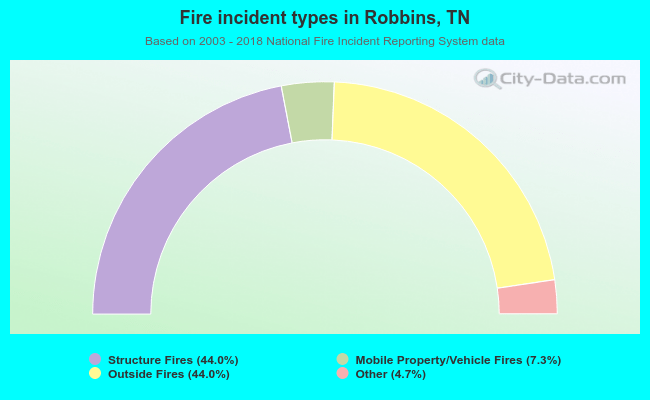 When looking into fire subcategories, the most reports belonged to: Structure Fires (44.0%), and Outside Fires (44.0%).