Robbinsville: Fire Incidents, North Carolina (NC)
Where are fire incidents reported in Robbinsville, NC
Something went wrong! Please refresh the page.
|
| |||||||||||||||||||||||||||||||||||||||||||||||||||||||||||||||||||||||||||||||||||||||||||||||||||||||||||||
| Other | 85 | |||||||||||||||||||||||||||||||||||||||||||||||||||||||||||||||||||||||||||||||||||||||||||||||||||||||||||||
2004 - 2018 National Fire Incident Reporting System (NFIRS) incidents
- Incident types reported to NFIRS in Robbinsville, NC
- 43641.2%Rescue & EMS
- 33731.8%Fire
- 12311.6%Service Call
- 595.6%Good Intent Call
- 373.5%Severe Weather
- 353.3%Special Incident
- 171.6%Hazardous Condition
- 151.4%False Alarm
- Fire incident types reported to NFIRS in Robbinsville, NC
- 13239.2%Outside Fires
- 12537.1%Structure Fires
- 4112.2%Other
- 3911.6%Mobile Property/Vehicle Fires
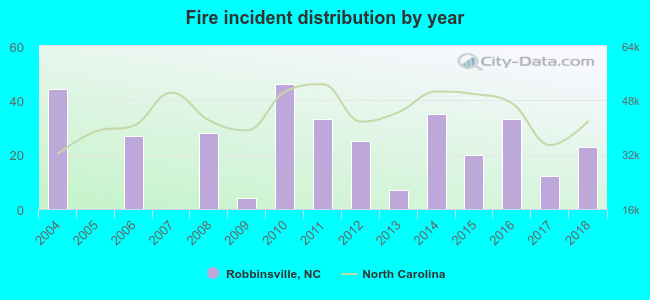 According to the data from the years 2004 - 2018 the average number of fires per year is 22. The highest number of fires - 46 took place in 2010, and the least - 0 in 2005. The data has a dropping trend.
 Based on the data from the years 2004 - 2018 the average number of fire-related fatalities per year is 0. The highest number of reported deaths - 1 took place in 2014, and the lowest - 0 in 2004. The data has a constant trend.
 According to the data from the years 2004 - 2018 the average number of fire-related yearly casualties is 1. The highest number of reported injuries - 6 took place in 2010, and the lowest - 0 in 2004. The data has a constant trend.
 28.5% incidents where reported in the morning and 71.5% in the evening. The most fires (15.7%) took place on Sunday, and the least (13.1%) on Wednesday.
 According to the 337 fire incident reports from years 2004 - 2018 most fires (16.0%) took place during March, and the least (3.9%) in September.
 Out of all 1,059 cases reported during the years 2004 - 2018, the most belonged to the categories: Overpressure Rupture (41.2%), Fire (31.8%), and Hazardous Condition (11.6%).
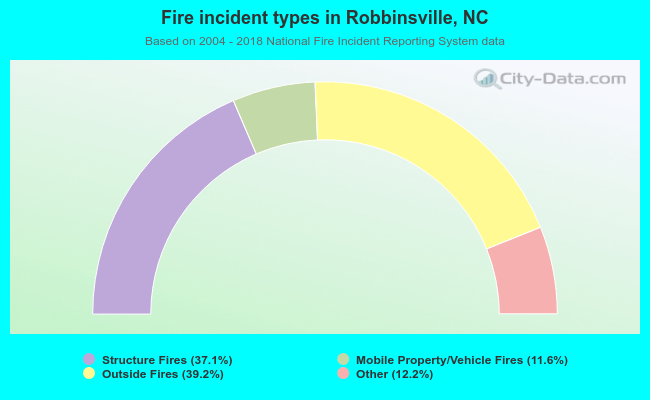 When looking into fire subcategories, the most reports belonged to: Outside Fires (39.2%), and Structure Fires (37.1%).