| Fire incidents reported |
|---|
| Sreet name | Count |
|---|
| FM 2034 | 8 | | AUSTIN ST | 6 | | 18TH & AUSTIN | 4 | | 208 | 4 | | 208 HWY | 4 | | FM 2059 | 4 | | LAKE SPENCE ESTATES | 4 | | MEADOW VIEW LN | 4 | | MUNNELL ROAD | 4 | | #40 WILDCAT MARINA | 2 | | 100 BLOCK 17TH STREET | 2 | | 11TH | 2 | | 11TH & EUEL | 2 | | 121 3RD STREET LGTS | 2 | | 12TH ST | 2 | | 1315 WEST LAKE DRIVE | 2 | | 18TH | 2 | | 302 WEST 4TH & ALAMO | 2 | | 3050 GRAHAM VALLEY ROAD | 2 | | 505 ZERO STREET | 2 | | 7 MILE HILL ROAD | 2 | | 7 MILE RD | 2 | | 7TH | 2 | | 9TH & EUEL | 2 | | 9TH ST | 2 |
| | | Fire incidents reported |
|---|
| Sreet name | Count |
|---|
| ADAMS LOOP | 2 | | CEDAR COVE ROAD | 2 | | CHADBORNE | 2 | | CHILDRESS | 2 | | CR 133 | 2 | | CR 2059 | 2 | | DRIFTWOOD ROAD/LANE | 2 | | FIELDS LANE | 2 | | FIRST ST | 2 | | FM 6059 | 2 | | GAS PLANT RD | 2 | | GAS PLANT ROAD | 2 | | GREENLAND ROAD | 2 | | HILCREST | 2 | | HILLCREST | 2 | | HWY 158 | 2 | | JONES CIR | 2 | | LAKE SPENCE ESTATE | 2 | | MARTIN LANE | 2 | | MEADOW LN | 2 | | MEADOW VIEW | 2 | | MEADOWVIEW LN | 2 | | N HWY 208 PIERCE RANCH | 2 | | NORTH DAM ROAD | 2 | | |
|
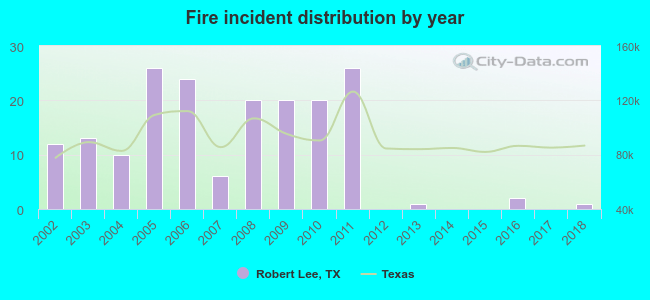 According to the data from the years 2002 - 2018 the average number of fires per year is 11. The highest number of reported fire incidents - 26 took place in 2005, and the least - 0 in 2012. The data has a decreasing trend.
 27.1% incidents where reported in the morning and 72.9% in the evening. The most fires (17.7%) took place on Tuesday, and the least (9.9%) on Monday.
 Based on the 181 incident reports from years 2002 - 2018 most fires (14.4%) took place during April, and the least (4.4%) in May.
 Out of all 251 cases reported during the years 2002 - 2018, the most belonged to the categories: Fire (72.1%), Hazardous Condition (14.3%), and Rescue & EMS (5.6%).
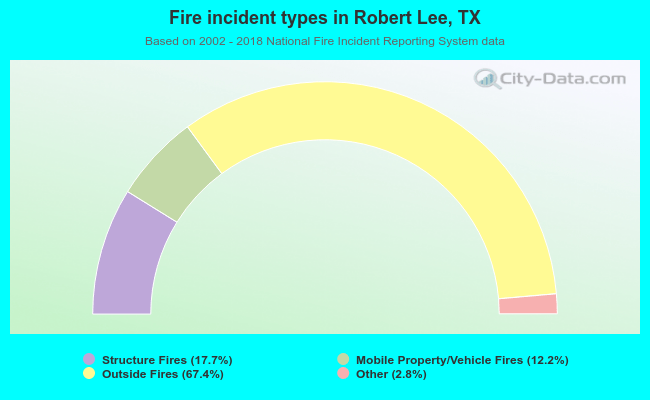 When looking into fire subcategories, the most reports belonged to: Outside Fires (67.4%), and Structure Fires (17.7%).