| Fire incidents reported |
|---|
| Sreet name | Count |
|---|
| TROY RD | 26 | | CENTER POINT RD | 18 | | MAIN ST | 12 | | CHARLOTTE AVE | 10 | | MENTZER RD | 6 | | PINE CREST DR | 6 | | ROBINS RD | 6 | | VOGT RD | 6 | | BROUGHAM RD | 4 | | COUNTY HOME RD | 4 | | EAST KNOLL DR | 4 | | EAST MAIN ST | 4 | | FEATHER RIDGE RD | 4 | | GRAND CT | 4 | | NORTHAVEN DR | 4 | | SYCAMORE CT | 4 | | 3RD AVE | 2 | | ALBURNETT RD | 2 | | BALI HAI CT | 2 | | BIRCH ST | 2 | | BLAIRS FERRY RD | 2 | | BLAIRS FERRY RD | 2 | | BLARNEY DR | 2 | | BOYSON RD | 2 | | CAMELOT PL | 2 |
| | | Fire incidents reported |
|---|
| Sreet name | Count |
|---|
| CARR RD | 2 | | CHESTER CT | 2 | | CHESTER RD | 2 | | CLARK ST | 2 | | COUNCIL ST | 2 | | CYPRESS CT | 2 | | E MAIN ST | 2 | | EASTVIEW DR | 2 | | ECHO HILL RD | 2 | | ELKHORN DR | 2 | | EVERGREEN LA | 2 | | FREESEWAY DR | 2 | | GEORGIA AVE | 2 | | GREY WOLF | 2 | | HUMMINGBIRD LA | 2 | | KERVIN CT | 2 | | LESLIE | 2 | | LOGGERHEAD & HUNT RD | 2 | | LONE TREE RD | 2 | | MANGO DR | 2 | | MAPLE ST | 2 | | MIDWAY RD | 2 | | NORMAN DR | 2 | | NORTH 18TH AVE AVE | 2 | | NORTH CENTER POINT RD | 2 |
|
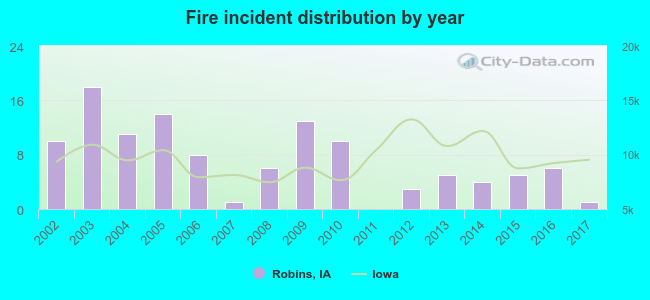 Based on the data from the years 2002 - 2017 the average number of fires per year is 7. The highest number of fires - 18 took place in 2003, and the least - 0 in 2011. The data has a dropping trend.
 26.1% incidents where reported in the morning and 73.9% in the evening. The most fires (21.7%) took place on Saturday, and the least (7.8%) on Friday.
 Based on the 115 reports from years 2002 - 2017 most fires (16.5%) took place during April, and the least (3.5%) in January.
 Out of all 431 cases reported during the years 2002 - 2017, the most belonged to the categories: Overpressure Rupture (41.8%), Fire (26.7%), and Rescue & EMS (13.0%).
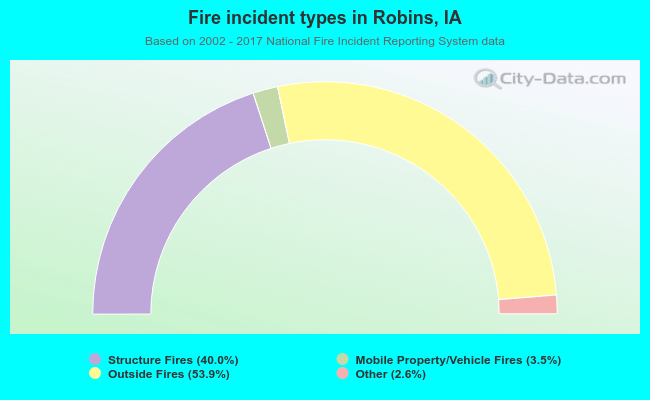 When looking into fire subcategories, the most reports belonged to: Outside Fires (53.9%), and Structure Fires (40.0%).