Rock Hill: Fire Incidents, Missouri (MO)
Where are fire incidents reported in Rock Hill, MO
Something went wrong! Please refresh the page.
|
| |||||||||||||||||||||||||||||||||||||||||||||||||||||||||||||||||||||||||||||||||||||||||||||||||||||||||||||
2002 - 2018 National Fire Incident Reporting System (NFIRS) incidents
- Incident types reported to NFIRS in Rock Hill, MO
- 2,49856.8%Rescue & EMS
- 66215.1%Hazardous Condition
- 3598.2%Fire
- 3538.0%Good Intent Call
- 3127.1%Service Call
- 1894.3%False Alarm
- 90.2%Severe Weather
- 80.2%Overpressure Rupture
- 80.2%Special Incident
- Fire incident types reported to NFIRS in Rock Hill, MO
- 23164.3%Structure Fires
- 6919.2%Outside Fires
- 308.4%Mobile Property/Vehicle Fires
- 298.1%Other
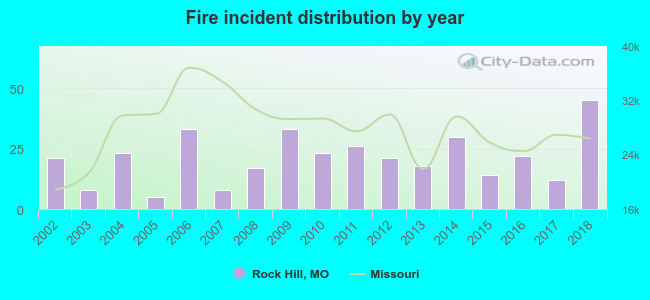 Based on the data from the years 2002 - 2018 the average number of fire incidents per year is 21. The highest number of reported fires - 45 took place in 2018, and the least - 5 in 2005. The data has an increasing trend.
 Based on the data from the years 2002 - 2018 the average number of fire-related yearly casualties is 0. The highest number of injuries - 1 took place in 2010, and the lowest - 0 in 2002. The data has an increasing trend.
 25.3% incidents where reported in the morning and 74.7% in the evening. The most fires (16.2%) took place on Saturday, and the least (12.0%) on Tuesday.
 Based on the 359 fires from years 2002 - 2018 most fires (10.9%) took place during July, and the least (4.7%) in May.
 Out of all 4,398 cases reported during the years 2002 - 2018, the most belonged to the categories: Rescue & EMS (56.8%), Hazardous Condition (15.1%), and Fire (8.2%).
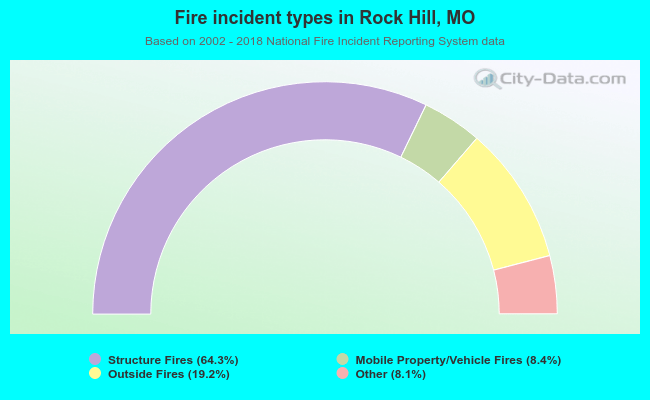 When looking into fire subcategories, the most reports belonged to: Structure Fires (64.3%), and Outside Fires (19.2%).