Rock Island: Fire Incidents, Washington (WA)
Where are fire incidents reported in Rock Island, WA
Something went wrong! Please refresh the page.
|
| |||||||||||||||||||||||||||||||||||||||||||||||||||||||||||||||||||||||||||||||||||||||||||||||||||||||||||||
2002 - 2018 National Fire Incident Reporting System (NFIRS) incidents
- Incident types reported to NFIRS in Rock Island, WA
- 21243.4%Rescue & EMS
- 14830.3%Fire
- 7014.3%Good Intent Call
- 347.0%Service Call
- 163.3%Hazardous Condition
- 81.6%False Alarm
- 10.2%Special Incident
- Fire incident types reported to NFIRS in Rock Island, WA
- 8557.4%Outside Fires
- 3825.7%Structure Fires
- 2013.5%Mobile Property/Vehicle Fires
- 53.4%Other
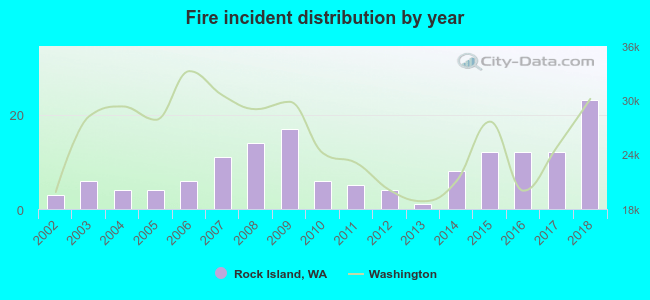 According to the data from the years 2002 - 2018 the average number of fires per year is 9. The highest number of fires - 23 took place in 2018, and the least - 1 in 2013. The data has a growing trend.
 30.4% incidents where reported in the morning and 69.6% in the evening. The most fires (20.3%) took place on Tuesday, and the least (8.1%) on Monday.
 Based on the 148 fires from years 2002 - 2018 most fires (14.9%) took place during May, and the least (1.4%) in February.
 Out of all 489 cases reported during the years 2002 - 2018, the most belonged to the categories: Overpressure Rupture (43.4%), Fire (30.3%), and Service Call (14.3%).
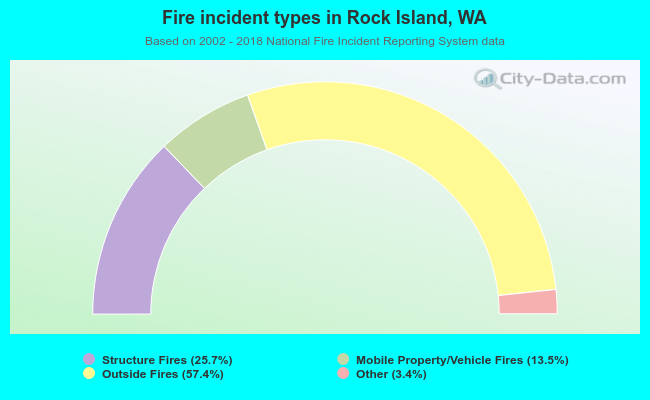 When looking into fire subcategories, the most reports belonged to: Outside Fires (57.4%), and Structure Fires (25.7%).