Rockaway Beach: Fire Incidents, Missouri (MO)
Where are fire incidents reported in Rockaway Beach, MO
Something went wrong! Please refresh the page.
|
| |||||||||||||||||||||||||||||||||||||||||||||||||||||||||||||||||||||||||||||||||||||||||||||||||||||||||||||
2006 - 2018 National Fire Incident Reporting System (NFIRS) incidents
- Incident types reported to NFIRS in Rockaway Beach, MO
- 33356.0%Rescue & EMS
- 13122.0%Fire
- 9115.3%Good Intent Call
- 203.4%Service Call
- 142.4%Hazardous Condition
- 50.8%False Alarm
- 10.2%Severe Weather
- Fire incident types reported to NFIRS in Rockaway Beach, MO
- 6348.1%Outside Fires
- 5642.7%Structure Fires
- 107.6%Mobile Property/Vehicle Fires
- 21.5%Other
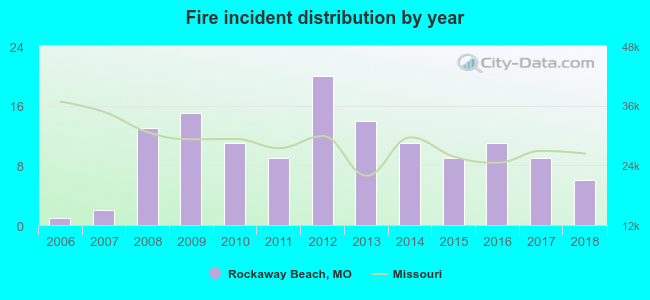 Based on the data from the years 2006 - 2018 the average number of fire incidents per year is 10. The highest number of reported fires - 20 took place in 2012, and the least - 1 in 2006. The data has an increasing trend.
 23.7% incidents where reported in the morning and 76.3% in the evening. The most fires (17.6%) took place on Monday, and the least (6.9%) on Thursday.
 Based on the 131 fires from years 2006 - 2018 most fires (16.8%) took place during March, and the least (3.1%) in May.
 Out of all 595 cases reported during the years 2006 - 2018, the most belonged to the categories: Overpressure Rupture (56.0%), Fire (22.0%), and Service Call (15.3%).
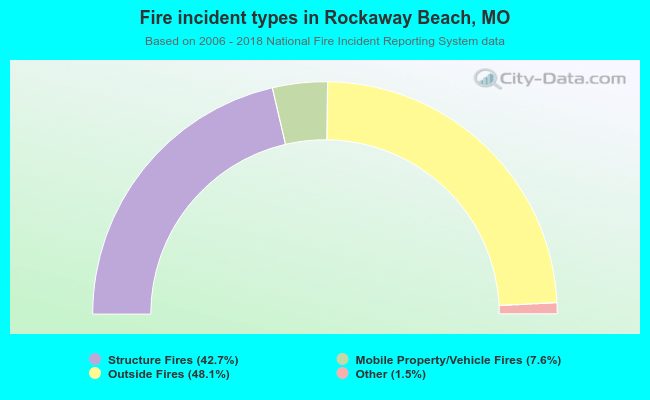 When looking into fire subcategories, the most reports belonged to: Outside Fires (48.1%), and Structure Fires (42.7%).