Rockingham: Fire Incidents, North Carolina (NC)
Where are fire incidents reported in Rockingham, NC
Something went wrong! Please refresh the page.
| Fire incidents reported | |
|---|---|
| Sreet name | Count |
| BROAD AVE | 206 |
| US 1 HWY | 84 |
| MIDWAY RD | 80 |
| LONG DR | 72 |
| ROCKINGHAM RD | 64 |
| SANDHILL RD | 54 |
| OLD CHERAW HWY | 46 |
| AIRPORT RD | 42 |
| BATTLEY DAIRY RD | 42 |
| FAYETTEVILLE RD | 40 |
| MILL RD | 40 |
| AIRPORT RD | 36 |
| CAUTHEN DR | 32 |
| CHURCH ST | 30 |
| OSBORNE RD | 30 |
| CAROLINE ST | 28 |
| COUNTY HOME RD | 28 |
| HANCOCK ST | 28 |
| BATTLEY DAIRY RD | 26 |
| US 74 BYP | 26 |
| US 74 HWY | 26 |
| MILL RD | 24 |
| MISPAH RD | 24 |
| ZION CHURCH RD | 24 |
| BATTLEY DAIRY ROAD | 22 |
| HICKORY ST | 22 |
| LOCH HAVEN RD | 22 |
| US 74 HWY | 22 |
| AIRPORT ROAD | 20 |
| OLD ABERDEEN RD | 20 |
| Other | 1,076 |
2002 - 2018 National Fire Incident Reporting System (NFIRS) incidents
- Incident types reported to NFIRS in Rockingham, NC
- 2,33635.3%Fire
- 1,64424.8%Hazardous Condition
- 1,20918.2%Rescue & EMS
- 6279.5%False Alarm
- 4056.1%Good Intent Call
- 3525.3%Service Call
- 410.6%Severe Weather
- 70.1%Special Incident
- Fire incident types reported to NFIRS in Rockingham, NC
- 99642.6%Structure Fires
- 99042.4%Outside Fires
- 32013.7%Mobile Property/Vehicle Fires
- 301.3%Other
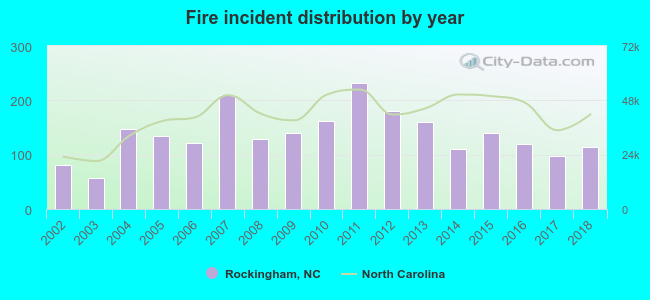 According to the data from the years 2002 - 2018 the average number of fires per year is 137. The highest number of fires - 232 took place in 2011, and the least - 57 in 2003. The data has a growing trend.
The average number of yearly fire incidents per 10k residents in Rockingham, NC compared to nearest cities:
(Note: Based on data for the last 3 years, including only cities with population 5,000 and above)
| Rockingham: | 119.3 |
| Hamlet: | 85.0 |
| Wadesboro: | 86.0 |
| Laurinburg: | 99.6 |
| Aberdeen: | 178.1 |
| Pinehurst: | 47.3 |
| Southern Pines: | 88.4 |
| Albemarle: | 84.7 |
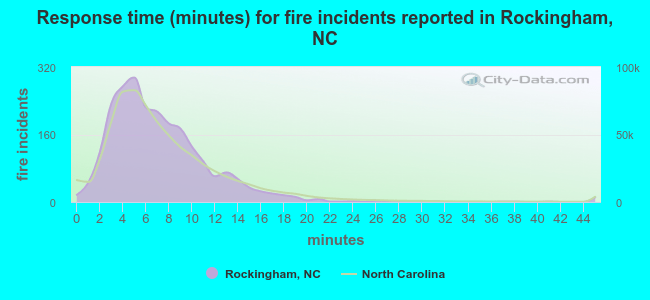 The median response time based on all reported fire incidents is 6 minutes. This is comparable to the state median value.
The median response time in Rockingham, NC compared to nearest cities:
(Note: Based on data for all years, including only cities with at least 500 fire incidents)
| Rockingham: | 6 minutes |
| Hamlet: | 7 minutes |
| Wadesboro: | 5 minutes |
| Pinebluff: | 8 minutes |
| Laurinburg: | 5 minutes |
| Aberdeen: | 5 minutes |
| Pinehurst: | 6 minutes |
| Southern Pines: | 5 minutes |
| Maxton: | 12 minutes |
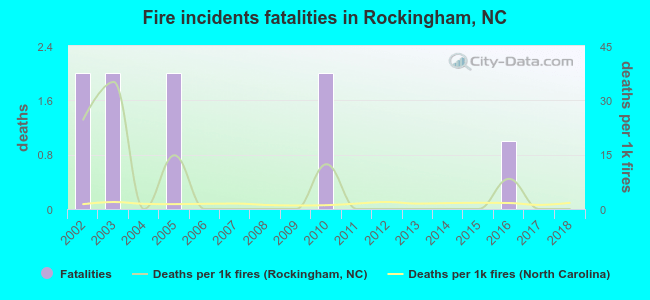 Based on the data from the years 2002 - 2018 the average number of fire-related fatalities per year is 1. The highest number of reported deaths - 2 took place in 2002, and the lowest - 0 in 2004. The data has a declining trend.
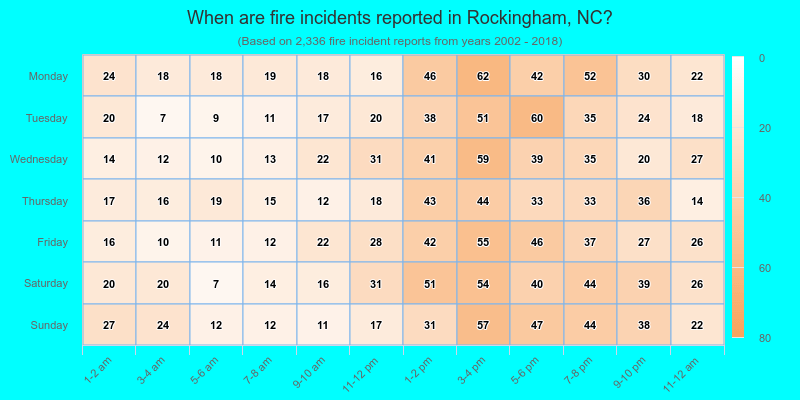
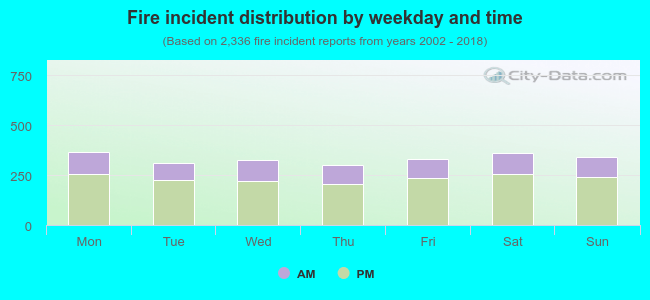 30.2% incidents where reported in the morning and 69.8% in the evening. The most fires (15.7%) took place on Monday, and the least (12.8%) on Thursday.
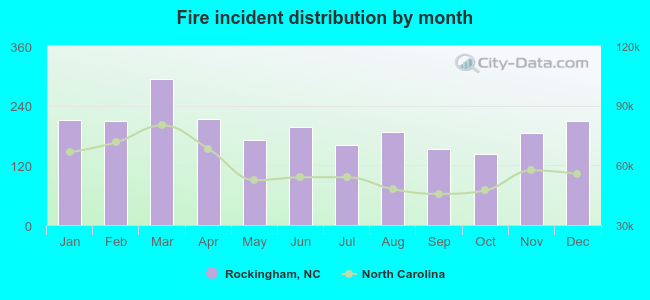 Based on the 2,336 fires from years 2002 - 2018 most fires (12.5%) took place during March, and the least (6.1%) in October.
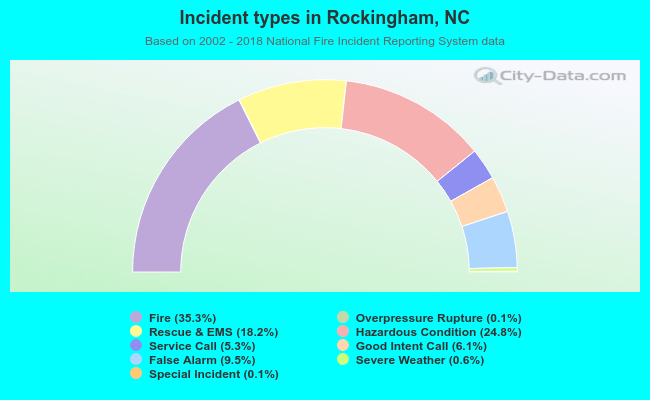 Out of all 6,625 cases reported during the years 2002 - 2018, the most belonged to the categories: Fire (35.3%), Hazardous Condition (24.8%), and Rescue & EMS (18.2%).
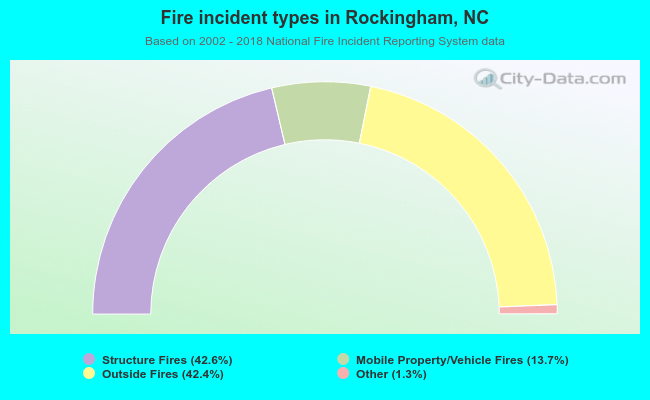 When looking into fire subcategories, the most reports belonged to: Structure Fires (42.6%), and Outside Fires (42.4%).