Rockland: Fire Incidents, Maine (ME)
Where are fire incidents reported in Rockland, ME
Something went wrong! Please refresh the page.
| Fire incidents reported | |
|---|---|
| Sreet name | Count |
| MAIN ST | 100 |
| PARK ST | 78 |
| OLD COUNTY RD | 54 |
| CAMDEN ST | 52 |
| GORDON DR | 48 |
| WHARF ST | 40 |
| BROADWAY | 32 |
| RANKIN ST | 30 |
| LIMEROCK ST | 24 |
| TALBOT AVE | 24 |
| UNION ST | 24 |
| BOG RD | 20 |
| CEDAR ST | 20 |
| LIME ST | 20 |
| SUMMER ST | 20 |
| BROADWAY AVE | 16 |
| MAVERICK ST | 16 |
| PACIFIC ST | 14 |
| PARK ST | 14 |
| PLEASANT ST | 14 |
| WATER ST | 14 |
| LINDSEY ST | 12 |
| MAIN ST | 12 |
| SUFFOLK ST | 12 |
| ACADIA DR | 10 |
| BROAD ST | 10 |
| COMMERCIAL ST | 10 |
| JAMES ST | 10 |
| LAKE AVE | 10 |
| NEW COUNTY RD | 10 |
2003 - 2018 National Fire Incident Reporting System (NFIRS) incidents
- Incident types reported to NFIRS in Rockland, ME
- 6,39968.3%Rescue & EMS
- 9189.8%Service Call
- 6346.8%Fire
- 6256.7%False Alarm
- 4454.8%Hazardous Condition
- 2382.5%Good Intent Call
- 991.1%Special Incident
- Fire incident types reported to NFIRS in Rockland, ME
- 39662.5%Structure Fires
- 15624.6%Outside Fires
- 619.6%Mobile Property/Vehicle Fires
- 213.3%Other
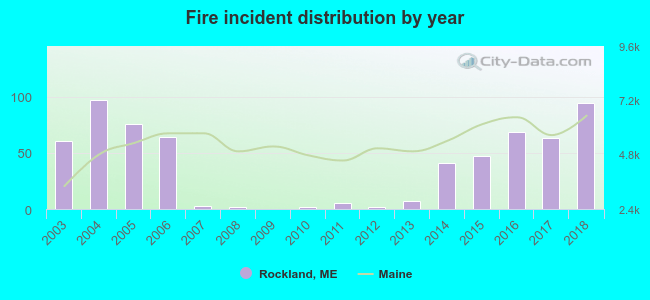 According to the data from the years 2003 - 2018 the average number of fire incidents per year is 40. The highest number of fires - 97 took place in 2004, and the least - 0 in 2009. The data has an increasing trend.
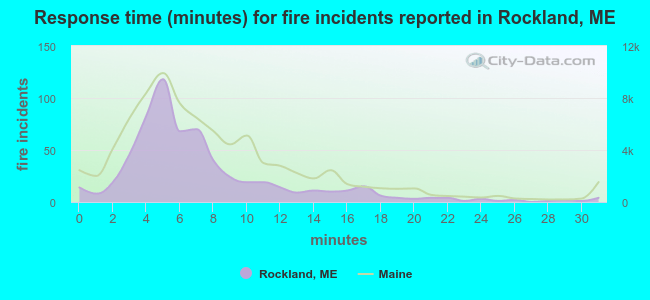 The median response time based on all reported fire incidents is 6 minutes. This is similar to the state median value.
The median response time in Rockland, ME compared to nearest cities:
(Note: Based on data for all years, including only cities with at least 500 fire incidents)
| Rockland: | 6 minutes |
| South Thomaston: | 7 minutes |
| Augusta: | 5 minutes |
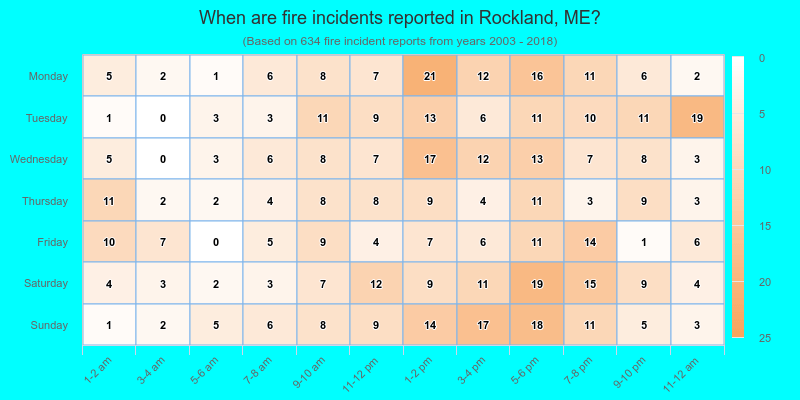
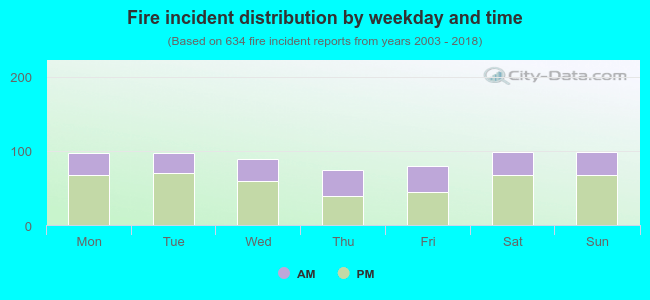 34.2% incidents where reported in the morning and 65.8% in the evening. The most fires (15.6%) took place on Sunday, and the least (11.7%) on Thursday.
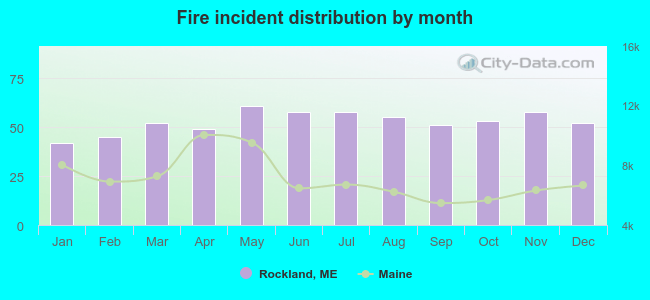 According to the 634 fire incidents from years 2003 - 2018 most fires (9.6%) took place during May, and the least (6.6%) in January.
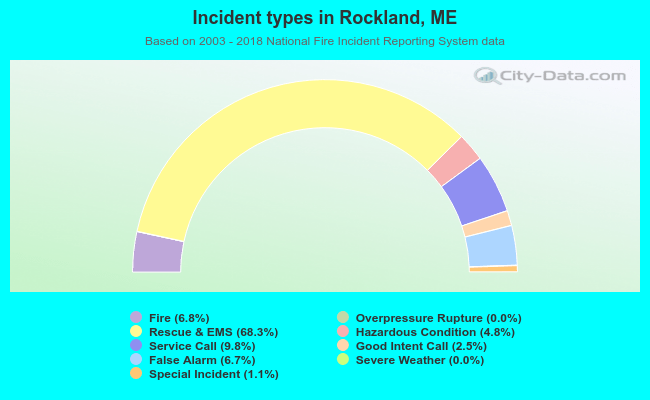 Out of all 9,366 cases reported during the years 2003 - 2018, the most belonged to the categories: Rescue & EMS (68.3%), Service Call (9.8%), and Fire (6.8%).
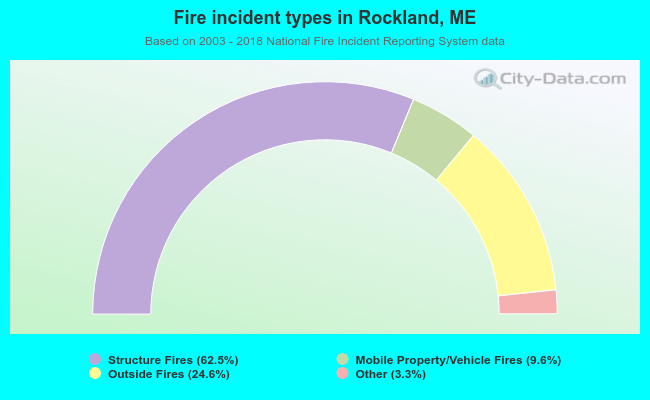 When looking into fire subcategories, the most reports belonged to: Structure Fires (62.5%), and Outside Fires (24.6%).