Roebling: Fire Incidents, New Jersey (NJ)
Where are fire incidents reported in Roebling, NJ
Something went wrong! Please refresh the page.
|
| |||||||||||||||||||||||||||||||||||||||||||||||||||||||||||||||||||||||||||||||||||||||||||||||||||||||||||||
2002 - 2018 National Fire Incident Reporting System (NFIRS) incidents
- Incident types reported to NFIRS in Roebling, NJ
- 18334.5%Hazardous Condition
- 14827.9%Fire
- 8415.8%Rescue & EMS
- 5710.8%False Alarm
- 468.7%Good Intent Call
- 101.9%Service Call
- 10.2%Overpressure Rupture
- 10.2%Special Incident
- Fire incident types reported to NFIRS in Roebling, NJ
- 8859.5%Structure Fires
- 4127.7%Outside Fires
- 1812.2%Mobile Property/Vehicle Fires
- 10.7%Other
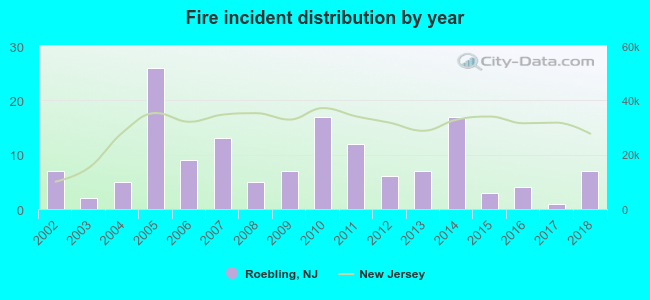 Based on the data from the years 2002 - 2018 the average number of fire incidents per year is 9. The highest number of reported fires - 26 took place in 2005, and the least - 1 in 2017. The data has a constant trend.
 24.3% incidents where reported in the morning and 75.7% in the evening. The most fires (20.3%) took place on Sunday, and the least (7.4%) on Thursday.
 Based on the 148 reports from years 2002 - 2018 most fires (13.5%) took place during February, and the least (2.7%) in October.
 Out of all 530 cases reported during the years 2002 - 2018, the most belonged to the categories: Hazardous Condition (34.5%), Fire (27.9%), and Rescue & EMS (15.8%).
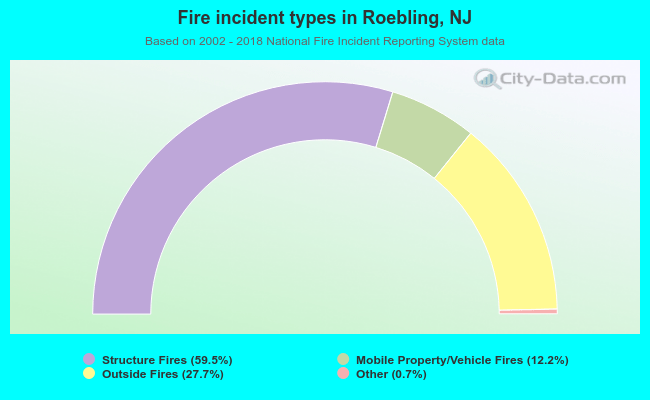 When looking into fire subcategories, the most reports belonged to: Structure Fires (59.5%), and Outside Fires (27.7%).