Rogers: Fire Incidents, Minnesota (MN)
Where are fire incidents reported in Rogers, MN
Something went wrong! Please refresh the page.
|
| |||||||||||||||||||||||||||||||||||||||||||||||||||||||||||||||||||||||||||||||||||||||||||||||||||||||||||||
2002 - 2018 National Fire Incident Reporting System (NFIRS) incidents
- Incident types reported to NFIRS in Rogers, MN
- 1,01836.9%Rescue & EMS
- 50618.4%Fire
- 41815.2%False Alarm
- 33212.0%Hazardous Condition
- 33012.0%Good Intent Call
- 1124.1%Service Call
- 190.7%Overpressure Rupture
- 160.6%Special Incident
- 60.2%Severe Weather
- Fire incident types reported to NFIRS in Rogers, MN
- 18837.2%Structure Fires
- 15931.4%Mobile Property/Vehicle Fires
- 14628.9%Outside Fires
- 132.6%Other
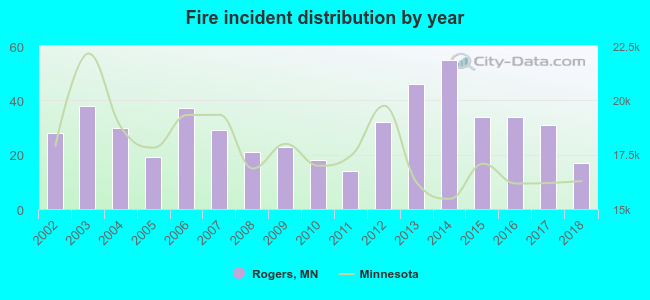 According to the data from the years 2002 - 2018 the average number of fires per year is 30. The highest number of fires - 55 took place in 2014, and the least - 14 in 2011. The data has a declining trend.
The average number of yearly fire incidents per 10k residents in Rogers, MN compared to nearest cities:
(Note: Based on data for the last 3 years, including only cities with population 5,000 and above)
| Rogers: | 22.1 |
| Otsego: | 11.7 |
| Albertville: | 17.9 |
| Corcoran: | 35.0 |
| Ramsey: | 15.8 |
| Maple Grove: | 9.9 |
| Elk River: | 24.0 |
| Anoka: | 32.2 |
| Champlin: | 12.0 |
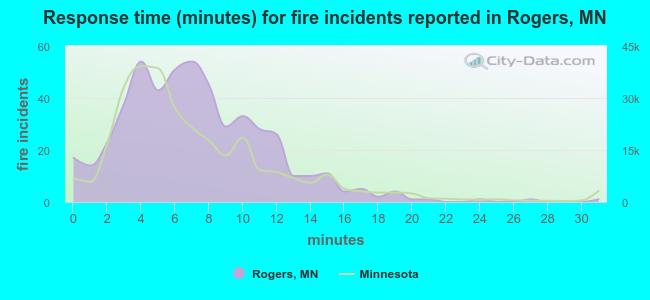 The median response time based on all reported fire incidents is 7 minutes. This is similar to the Minnesota median value.
The median response time in Rogers, MN compared to nearest cities:
(Note: Based on data for all years, including only cities with at least 500 fire incidents)
| Rogers: | 7 minutes |
| Ramsey: | 7 minutes |
| Maple Grove: | 7 minutes |
| Elk River: | 8 minutes |
| Anoka: | 6 minutes |
| Champlin: | 9 minutes |
| Andover: | 8 minutes |
| Brooklyn Park: | 5 minutes |
| Coon Rapids: | 5 minutes |
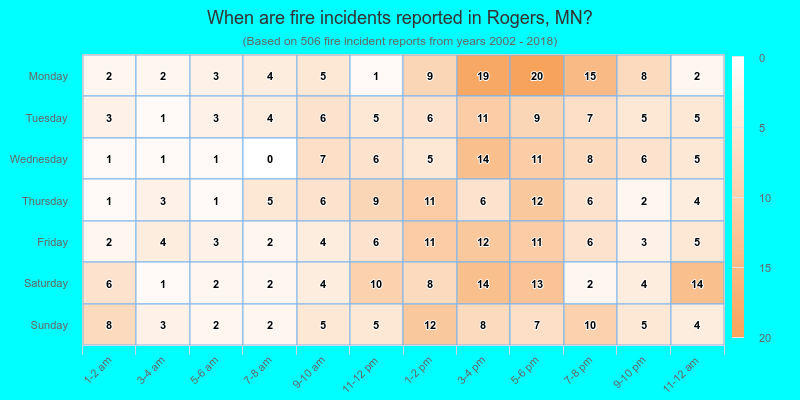
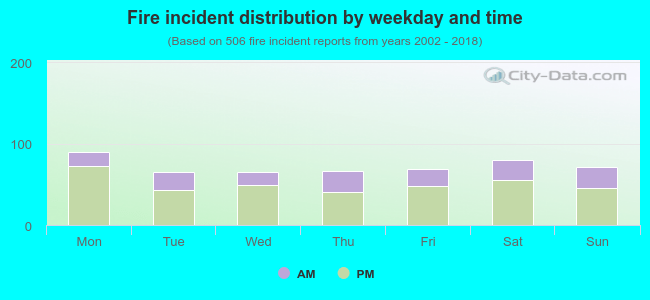 29.8% incidents where reported in the morning and 70.2% in the evening. The most fires (17.8%) took place on Monday, and the least (12.8%) on Tuesday.
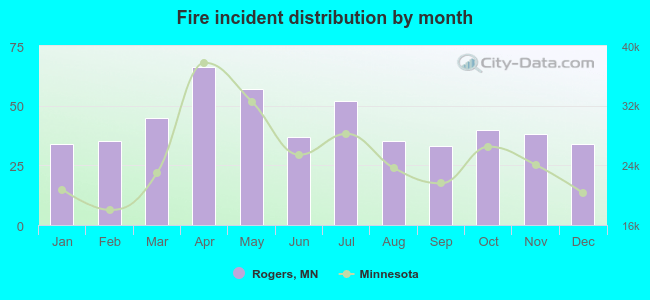 According to the 506 fire incident reports from years 2002 - 2018 most fires (13.0%) took place during April, and the least (6.5%) in September.
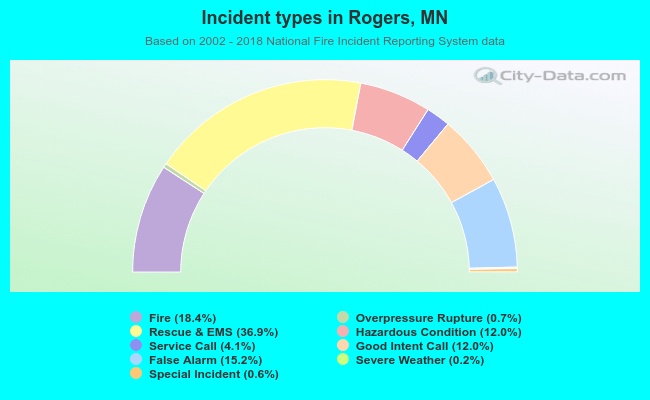 Out of all 2,757 cases reported during the years 2002 - 2018, the most belonged to the categories: Rescue & EMS (36.9%), Fire (18.4%), and False Alarm (15.2%).
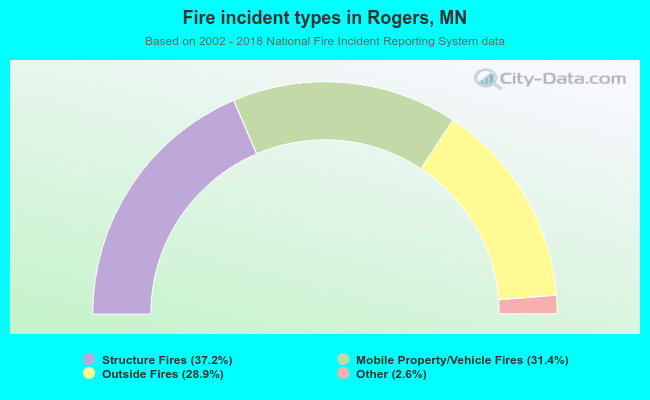 When looking into fire subcategories, the most incidents belonged to: Structure Fires (37.2%), and Mobile Property/Vehicle Fires (31.4%).