Rollinsford: Fire Incidents, New Hampshire (NH)
Where are fire incidents reported in Rollinsford, NH
Something went wrong! Please refresh the page.
|
| |||||||||||||||||||||||||||||||||||||||||||||||||||||||||||||||||||||||||||||||||||||||||||||||||||||||||
2004 - 2018 National Fire Incident Reporting System (NFIRS) incidents
- Incident types reported to NFIRS in Rollinsford, NH
- 53345.3%Hazardous Condition
- 17615.0%Service Call
- 17014.4%Rescue & EMS
- 12210.4%Fire
- 958.1%False Alarm
- 746.3%Good Intent Call
- 30.3%Overpressure Rupture
- 30.3%Special Incident
- Fire incident types reported to NFIRS in Rollinsford, NH
- 6150.0%Structure Fires
- 4839.3%Outside Fires
- 97.4%Mobile Property/Vehicle Fires
- 43.3%Other
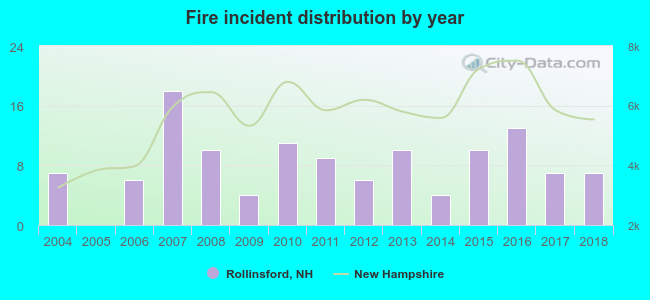 According to the data from the years 2004 - 2018 the average number of fire incidents per year is 8. The highest number of reported fire incidents - 18 took place in 2007, and the least - 0 in 2005. The data has a constant trend.
 32.0% incidents where reported in the morning and 68.0% in the evening. The most fires (19.7%) took place on Monday, and the least (10.7%) on Wednesday.
 Based on the 122 fire incident reports from years 2004 - 2018 most fires (17.2%) took place during April, and the least (4.1%) in August.
 Out of all 1,177 cases reported during the years 2004 - 2018, the most belonged to the categories: Hazardous Condition (45.3%), Service Call (15.0%), and Rescue & EMS (14.4%).
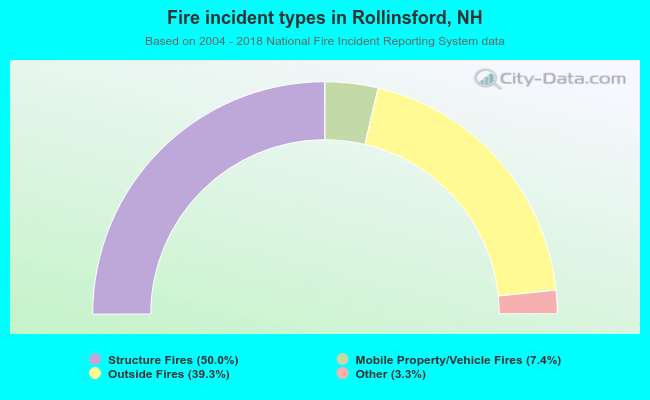 When looking into fire subcategories, the most incidents belonged to: Structure Fires (50.0%), and Outside Fires (39.3%).