Rome City: Fire Incidents, Indiana (IN)
Where are fire incidents reported in Rome City, IN
Something went wrong! Please refresh the page.
|
| |||||||||||||||||||||||||||||||||||||||||||||||||||||||||||||||||||||||||||||||||||||||||||||||||||||||||||||
2002 - 2018 National Fire Incident Reporting System (NFIRS) incidents
- Incident types reported to NFIRS in Rome City, IN
- 17739.7%Fire
- 16136.1%Rescue & EMS
- 7316.4%Hazardous Condition
- 245.4%Service Call
- 61.3%Severe Weather
- 40.9%Good Intent Call
- 10.2%False Alarm
- Fire incident types reported to NFIRS in Rome City, IN
- 7642.9%Outside Fires
- 7341.2%Structure Fires
- 169.0%Other
- 126.8%Mobile Property/Vehicle Fires
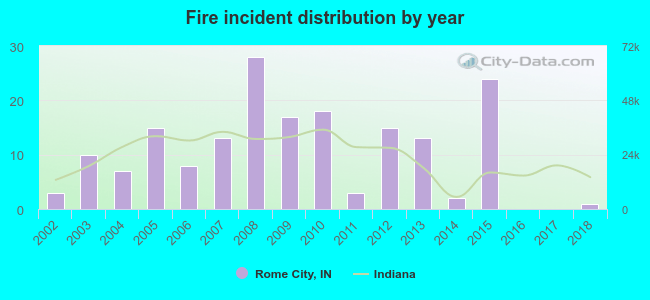 Based on the data from the years 2002 - 2018 the average number of fire incidents per year is 10. The highest number of fire incidents - 28 took place in 2008, and the least - 0 in 2016. The data has a decreasing trend.
 28.8% incidents where reported in the morning and 71.2% in the evening. The most fires (20.3%) took place on Sunday, and the least (7.9%) on Wednesday.
 According to the 177 fire incidents from years 2002 - 2018 most fires (19.2%) took place during April, and the least (2.8%) in September.
 Out of all 446 cases reported during the years 2002 - 2018, the most belonged to the categories: Fire (39.7%), Overpressure Rupture (36.1%), and Rescue & EMS (16.4%).
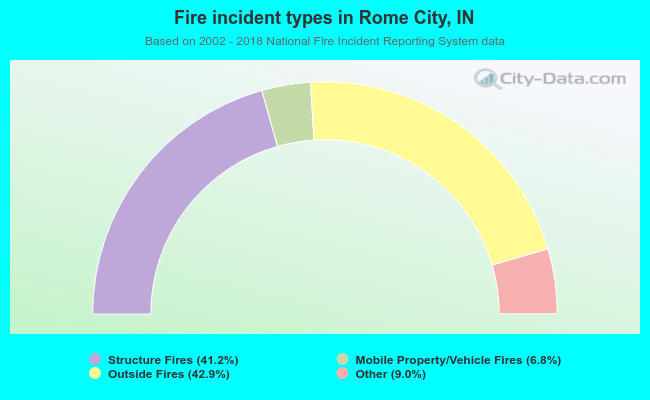 When looking into fire subcategories, the most incidents belonged to: Outside Fires (42.9%), and Structure Fires (41.2%).