| Fire incidents reported |
|---|
| Sreet name | Count |
|---|
| STATE ROUTE 6 | 72 | | ROUTE 534 | 66 | | 45 ROME RT | 58 | | 6 ROME RT | 40 | | DODGEVILLE RD | 36 | | LASKEY RD | 36 | | WINDSOR MECHANICSVILLE RD | 36 | | 45 RT | 30 | | ROUTE 45 | 28 | | CALLENDAR RD | 24 | | IRELAND RD | 18 | | HYDE RD | 14 | | JOHNSON RD | 14 | | DODGE RD | 12 | | DODGEVILLE - ROME TWP RD | 12 | | HULBERT RD | 12 | | ROUTE 46 | 10 | | BROWNVILLE RD | 8 | | CALLAHAN RD | 8 | | HIGLEY RD | 8 | | HYDE ROAD | 8 | | MEADE HOLLOW RD | 8 | | OAKRIDGE DR | 8 | | PRICE RD | 8 | | 6 RT | 6 |
| | | Fire incidents reported |
|---|
| Sreet name | Count |
|---|
| BROWNVILLE ROAD | 6 | | FILLINGHAM RD | 6 | | GAR HWY | 6 | | KETCHUM RD | 6 | | ROME ROCK CREEK RD | 6 | | ROME ROCK CREEK ROME RD | 6 | | ST RT 46 | 6 | | US 52 | 6 | | BOGUE RD | 4 | | BOYMAR RD | 4 | | CALLANDER RD | 4 | | CALLENDER RD | 4 | | CHESTER RD | 4 | | CROSBY COOK RD | 4 | | DODGEVILLE RD | 4 | | DODGEVILLE ROAD | 4 | | DODGEVILLE ROME TWP RD | 4 | | HOFFMAN | 4 | | ROUTE 6 | 4 | | ST. RT. 45 (ROME) | 4 | | STATE ROUTE 534 | 4 | | STATE RT 6 RT | 4 | | SUMMERS RD | 4 | | US ROUTE 6 | 4 | | |
|
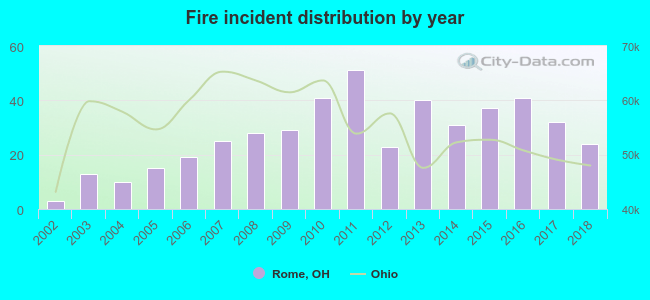 According to the data from the years 2002 - 2018 the average number of fire incidents per year is 27. The highest number of reported fire incidents - 51 took place in 2011, and the least - 3 in 2002. The data has an increasing trend.
 27.5% incidents where reported in the morning and 72.5% in the evening. The most fires (16.9%) took place on Tuesday, and the least (11.0%) on Saturday.
 Based on the 462 fires from years 2002 - 2018 most fires (18.0%) took place during April, and the least (5.4%) in June.
 Out of all 1,052 cases reported during the years 2002 - 2018, the most belonged to the categories: Fire (43.9%), Hazardous Condition (41.0%), and Service Call (6.6%).
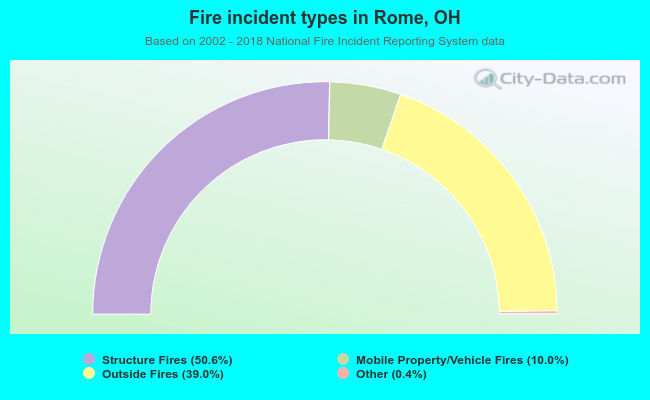 When looking into fire subcategories, the most reports belonged to: Structure Fires (50.6%), and Outside Fires (39.0%).