Rosamond: Fire Incidents, California (CA)
Where are fire incidents reported in Rosamond, CA
Something went wrong! Please refresh the page.
| Fire incidents reported | |
|---|---|
| Sreet name | Count |
| ROSAMOND BLVD | 206 |
| SIERRA HWY | 68 |
| 15TH STREET WEST | 52 |
| 14 NORTH HWY | 42 |
| 20TH STREET WEST | 36 |
| ROSAMOND BLVD | 34 |
| MOJAVE TROPICO RD | 30 |
| DESERT ST | 26 |
| SIERRA HWY | 26 |
| 40TH STREET WEST | 22 |
| ELBERTA ST | 22 |
| 60TH ST | 20 |
| DIAMOND ST | 20 |
| 14 SOUTH HWY | 18 |
| POPLAR ST | 18 |
| GLENDOWER ST | 16 |
| SWEETSER RD | 16 |
| 50TH STREET WEST | 14 |
| DIXIE ST | 14 |
| HWY 14 | 14 |
| 15TH ST | 12 |
| 60TH ST W | 12 |
| AVENUE A | 12 |
| B ST | 12 |
| GASKELL RD | 12 |
| HARVELL PL | 12 |
| ORANGE ST | 12 |
| STAGECOACH LN | 12 |
| 20TH ST | 10 |
| 25TH STREET WEST | 10 |
| Other | 61 |
2005 - 2018 National Fire Incident Reporting System (NFIRS) incidents
- Incident types reported to NFIRS in Rosamond, CA
- 3,59446.9%Rescue & EMS
- 1,94825.4%Good Intent Call
- 89111.6%Fire
- 5747.5%Hazardous Condition
- 2943.8%Service Call
- 2383.1%False Alarm
- 891.2%Special Incident
- 290.4%Overpressure Rupture
- Fire incident types reported to NFIRS in Rosamond, CA
- 47753.5%Outside Fires
- 28031.4%Structure Fires
- 13114.7%Mobile Property/Vehicle Fires
- 30.3%Other
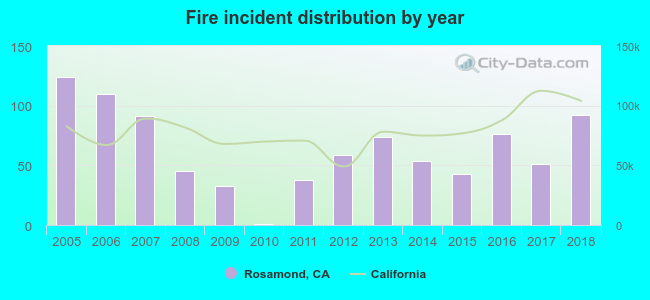 According to the data from the years 2005 - 2018 the average number of fires per year is 64. The highest number of reported fire incidents - 124 took place in 2005, and the least - 1 in 2010. The data has a decreasing trend.
The average number of yearly fire incidents per 10k residents in Rosamond, CA compared to nearest cities:
(Note: Based on data for the last 3 years, including only cities with population 5,000 and above)
| Rosamond: | 40.2 |
| Lancaster: | 21.1 |
| Quartz Hill: | 14.4 |
| Palmdale: | 16.5 |
| Tehachapi: | 34.8 |
| Golden Hills: | 27.1 |
| Acton: | 64.1 |
| Lake Los Angeles: | 46.5 |
| California City: | 5.8 |
 The median response time based on all reported fire incidents is 10 minutes. This is higher compared to the California median value.
The median response time in Rosamond, CA compared to nearest cities:
(Note: Based on data for all years, including only cities with at least 500 fire incidents)
| Rosamond: | 10 minutes |
| Lancaster: | 5 minutes |
| Palmdale: | 5 minutes |
| Tehachapi: | 7 minutes |
| Lake Los Angeles: | 6 minutes |
| Santa Clarita: | 5 minutes |
| Lebec: | 10 minutes |
| Arvin: | 7 minutes |
| Altadena: | 5 minutes |
 32.7% incidents where reported in the morning and 67.3% in the evening. The most fires (16.9%) took place on Saturday, and the least (11.8%) on Wednesday.
 Based on the 891 fire incidents from years 2005 - 2018 most fires (13.9%) took place during June, and the least (5.8%) in January.
 Out of all 7,657 cases reported during the years 2005 - 2018, the most belonged to the categories: Rescue & EMS (46.9%), Good Intent Call (25.4%), and Fire (11.6%).
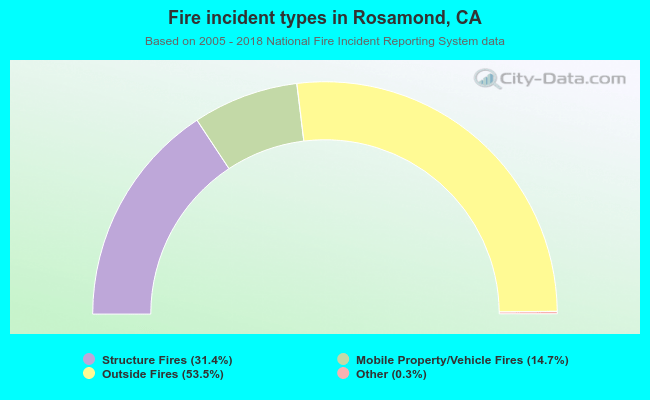 When looking into fire subcategories, the most reports belonged to: Outside Fires (53.5%), and Structure Fires (31.4%).