Rosemount: Fire Incidents, Minnesota (MN)
Where are fire incidents reported in Rosemount, MN
Something went wrong! Please refresh the page.
|
| |||||||||||||||||||||||||||||||||||||||||||||||||||||||||||||||||||||||||||||||||||||||||||||||||||||||||||||
2002 - 2018 National Fire Incident Reporting System (NFIRS) incidents
- Incident types reported to NFIRS in Rosemount, MN
- 2,25153.4%Rescue & EMS
- 81319.3%Hazardous Condition
- 47011.2%Fire
- 3578.5%False Alarm
- 2616.2%Good Intent Call
- 511.2%Service Call
- 80.2%Severe Weather
- Fire incident types reported to NFIRS in Rosemount, MN
- 20944.5%Structure Fires
- 14029.8%Outside Fires
- 7916.8%Mobile Property/Vehicle Fires
- 428.9%Other
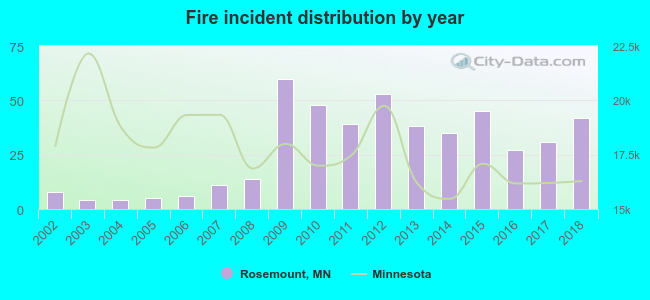 According to the data from the years 2002 - 2018 the average number of fires per year is 28. The highest number of fires - 60 took place in 2009, and the least - 4 in 2003. The data has a rising trend.
The average number of yearly fire incidents per 10k residents in Rosemount, MN compared to nearest cities:
(Note: Based on data for the last 3 years, including only cities with population 5,000 and above)
| Rosemount: | 14.5 |
| Apple Valley: | 16.2 |
| Eagan: | 12.1 |
| Farmington: | 18.0 |
| Lakeville: | 13.6 |
| Inver Grove Heights: | 20.9 |
| Burnsville: | 19.6 |
| Mendota Heights: | 15.1 |
| Cottage Grove: | 12.2 |
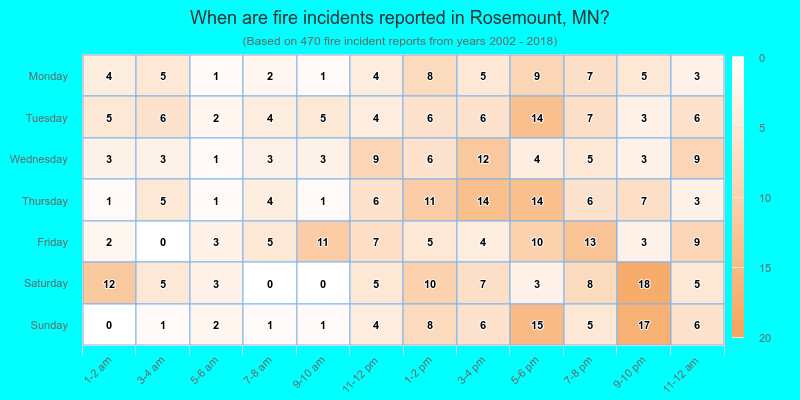
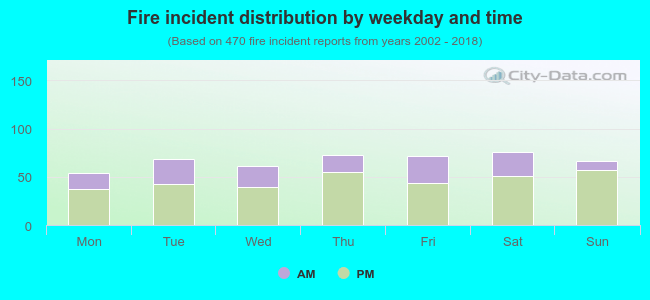 30.9% incidents where reported in the morning and 69.1% in the evening. The most fires (16.2%) took place on Saturday, and the least (11.5%) on Monday.
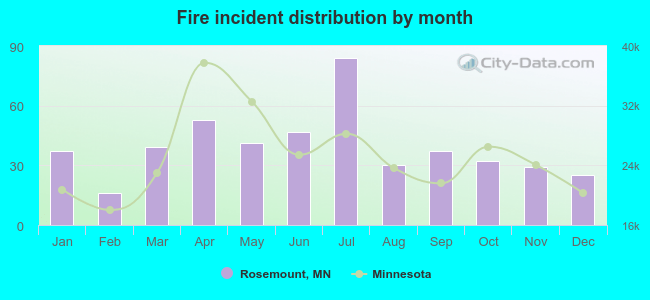 According to the 470 reports from years 2002 - 2018 most fires (17.9%) took place during July, and the least (3.4%) in February.
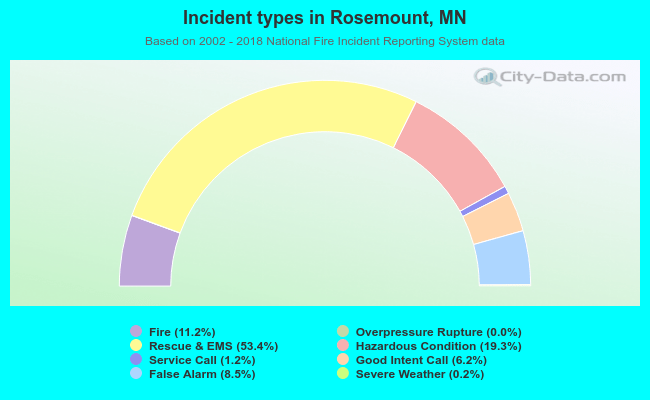 Out of all 4,213 cases reported during the years 2002 - 2018, the most belonged to the categories: Rescue & EMS (53.4%), Hazardous Condition (19.3%), and Fire (11.2%).
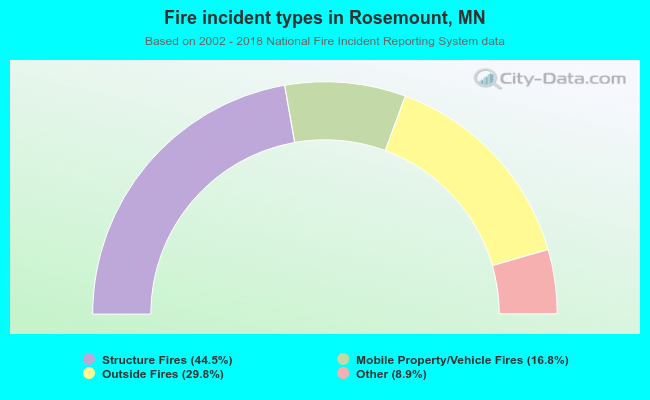 When looking into fire subcategories, the most reports belonged to: Structure Fires (44.5%), and Outside Fires (29.8%).