Roseville: Fire Incidents, California (CA)
Where are fire incidents reported in Roseville, CA
Something went wrong! Please refresh the page.
| Fire incidents reported | |
|---|---|
| Sreet name | Count |
| I80 | 118 |
| EUREKA RD | 104 |
| FAIRWAY DR | 98 |
| GIBSON DR | 86 |
| FOOTHILLS BL | 84 |
| SUNRISE AVE | 78 |
| PLEASANT GROVE BLVD | 76 |
| FOOTHILLS BLVD | 74 |
| VERNON ST | 74 |
| ROSEVILLE PW | 72 |
| DOUGLAS BL | 70 |
| PLEASANT GROVE BL | 70 |
| SUNRISE AV | 64 |
| WOODCREEK OAKS BL | 62 |
| TAYLOR RD | 56 |
| ROSEVILLE | 54 |
| BASE LINE RD | 52 |
| CIRBY WY | 50 |
| DOUGLAS BLVD | 50 |
| GALLERIA BL | 44 |
| STANFORD RANCH RD | 44 |
| CONROY LN | 42 |
| MAIN ST | 42 |
| HWY 65 | 40 |
| KINGSWOOD DR | 40 |
| PFE RD | 38 |
| GALLERIA BLVD | 36 |
| HARDING BL | 36 |
| PHILLIP RD | 36 |
| RIVERSIDE AVE | 36 |
| Other | 873 |
2005 - 2018 National Fire Incident Reporting System (NFIRS) incidents
- Incident types reported to NFIRS in Roseville, CA
- 41,43365.4%Rescue & EMS
- 8,23613.0%Good Intent Call
- 6,44910.2%Service Call
- 2,6994.3%Fire
- 2,5754.1%False Alarm
- 1,8412.9%Hazardous Condition
- Fire incident types reported to NFIRS in Roseville, CA
- 1,31448.7%Outside Fires
- 85931.8%Structure Fires
- 41015.2%Mobile Property/Vehicle Fires
- 1164.3%Other
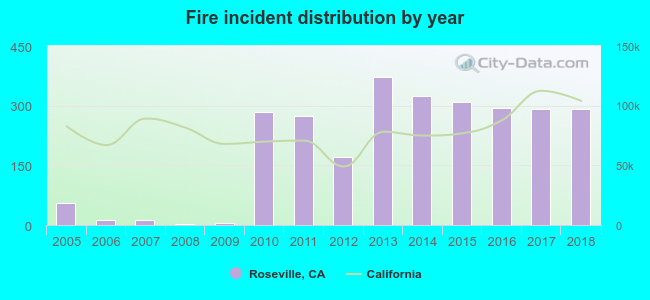 According to the data from the years 2005 - 2018 the average number of fires per year is 193. The highest number of fires - 371 took place in 2013, and the least - 3 in 2008. The data has a rising trend.
The average number of yearly fire incidents per 10k residents in Roseville, CA compared to nearest cities:
(Note: Based on data for the last 3 years, including only cities with population 5,000 and above)
| Roseville: | 22.8 |
| Antelope: | 11.7 |
| Citrus Heights: | 28.1 |
| Rocklin: | 17.7 |
| Granite Bay: | 28.4 |
| Orangevale: | 13.5 |
| Loomis: | 98.1 |
| North Highlands: | 46.8 |
| Fair Oaks: | 14.0 |
 The median response time based on all reported fire incidents is 5 minutes. This is lower compared to the California median value.
The median response time in Roseville, CA compared to nearest cities:
(Note: Based on data for all years, including only cities with at least 500 fire incidents)
| Roseville: | 5 minutes |
| Antelope: | 5 minutes |
| Citrus Heights: | 5 minutes |
| Rocklin: | 6 minutes |
| Granite Bay: | 7 minutes |
| Orangevale: | 5 minutes |
| Loomis: | 8 minutes |
| North Highlands: | 5 minutes |
| Fair Oaks: | 5 minutes |
 Based on the reports from the years 2005 - 2018 the average number of fire-related yearly casualties is 2. The highest number of casualties - 5 took place in 2015, and the lowest - 0 in 2005. The data has a rising trend.
The average number of injuries per 1,000 fire incidents is 5. This indicator was the highest - 16 in 2015, and the lowest 0 in 2005. The trend for casualties per 1,000 incidents is increasing. Compared to the state value the number of casualties per 1,000 fires is higher.
Based on the reports from the years 2005 - 2018 the average number of fire-related yearly casualties is 2. The highest number of casualties - 5 took place in 2015, and the lowest - 0 in 2005. The data has a rising trend.
The average number of injuries per 1,000 fire incidents is 5. This indicator was the highest - 16 in 2015, and the lowest 0 in 2005. The trend for casualties per 1,000 incidents is increasing. Compared to the state value the number of casualties per 1,000 fires is higher.Casualties per 1,000 incidents in Roseville, CA compared to nearest cities:
(Note: Based on data for all years, including only cities with at least 500 fire incidents)
| Roseville: | 8.2 |
| Antelope: | 1.5 |
| Citrus Heights: | 3.8 |
| Rocklin: | 1.9 |
| Granite Bay: | 1.8 |
| Orangevale: | 1.7 |
| Loomis: | 0.0 |
| North Highlands: | 0.0 |
| Fair Oaks: | 3.6 |
 30.7% incidents where reported in the morning and 69.3% in the evening. The most fires (15.3%) took place on Wednesday, and the least (13.3%) on Thursday.
 Based on the 2,699 incident reports from years 2005 - 2018 most fires (16.2%) took place during July, and the least (4.9%) in February.
 Out of all 63,332 cases reported during the years 2005 - 2018, the most belonged to the categories: Rescue & EMS (65.4%), Good Intent Call (13.0%), and Service Call (10.2%).
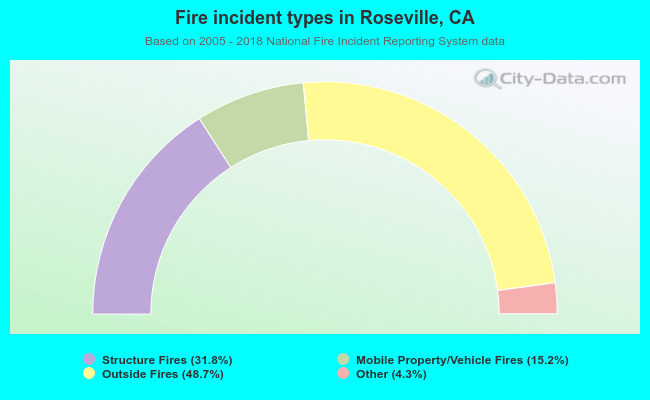 When looking into fire subcategories, the most incidents belonged to: Outside Fires (48.7%), and Structure Fires (31.8%).