Roundup: Fire Incidents, Montana (MT)
Where are fire incidents reported in Roundup, MT
Something went wrong! Please refresh the page.
|
| |||||||||||||||||||||||||||||||||||||||||||||||||||||||||||||||||||||||||||||||||||||||||||||||||||||||||||||
| Other | 121 | |||||||||||||||||||||||||||||||||||||||||||||||||||||||||||||||||||||||||||||||||||||||||||||||||||||||||||||
2002 - 2017 National Fire Incident Reporting System (NFIRS) incidents
- Incident types reported to NFIRS in Roundup, MT
- 30967.6%Fire
- 9621.0%Hazardous Condition
- 214.6%Good Intent Call
- 143.1%Rescue & EMS
- 112.4%False Alarm
- 30.7%Severe Weather
- 20.4%Service Call
- 10.2%Special Incident
- Fire incident types reported to NFIRS in Roundup, MT
- 19462.8%Outside Fires
- 7724.9%Structure Fires
- 299.4%Mobile Property/Vehicle Fires
- 92.9%Other
 According to the data from the years 2002 - 2017 the average number of fires per year is 19. The highest number of reported fire incidents - 69 took place in 2006, and the least - 0 in 2008. The data has a decreasing trend.
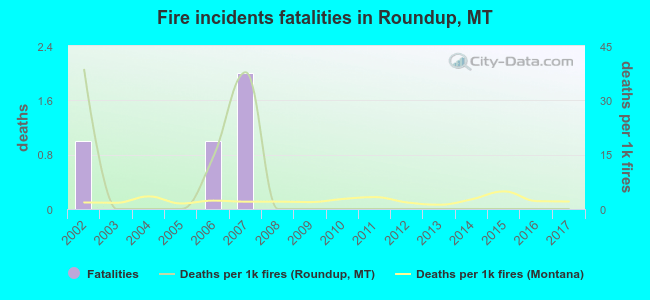 Based on the reports from the years 2002 - 2017 the average number of fire-related fatalities per year is 0. The highest number of reported deaths - 2 took place in 2007, and the lowest - 0 in 2003. The data has a decreasing trend.
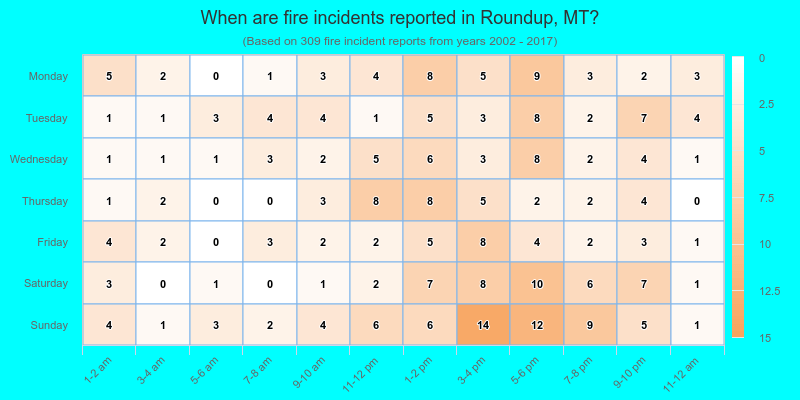
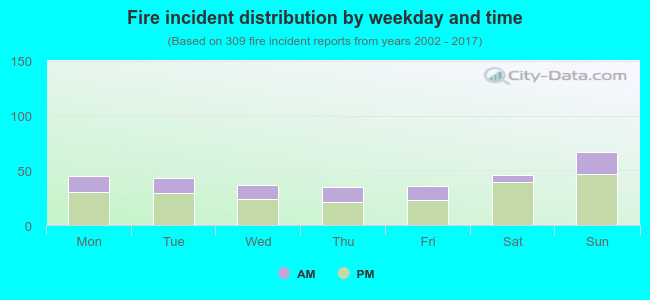 31.1% incidents where reported in the morning and 68.9% in the evening. The most fires (21.7%) took place on Sunday, and the least (11.3%) on Thursday.
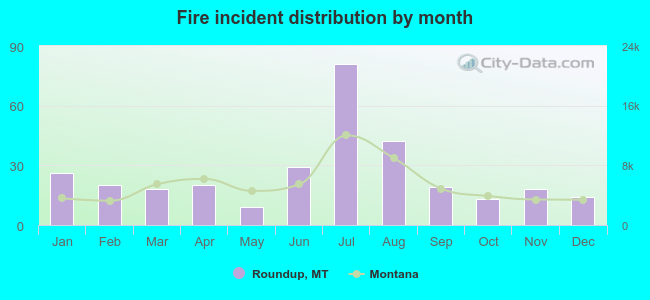 Based on the 309 fires from years 2002 - 2017 most fires (26.2%) took place during July, and the least (2.9%) in May.
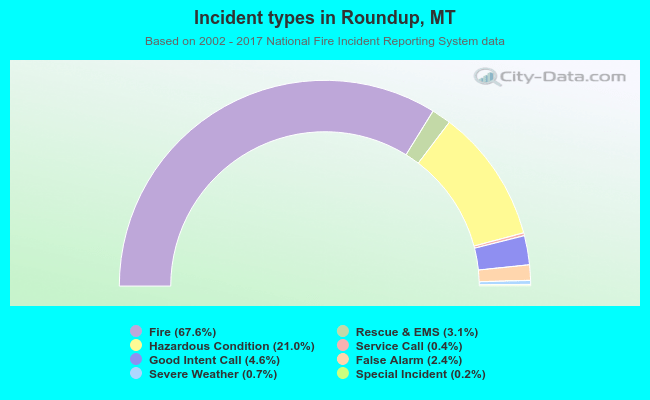 Out of all 457 cases reported during the years 2002 - 2017, the most belonged to the categories: Fire (67.6%), Rescue & EMS (21.0%), and Service Call (4.6%).
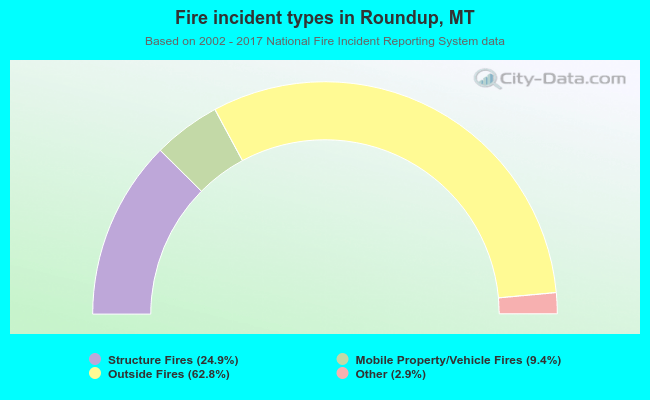 When looking into fire subcategories, the most incidents belonged to: Outside Fires (62.8%), and Structure Fires (24.9%).