| Fire incidents reported |
|---|
| Sreet name | Count |
|---|
| BRADFORD HWY HWY | 14 | | CHEEK ROAD | 14 | | KENTON HWY | 14 | | MANCHESTER PIKE | 14 | | SHELBYVILLE PIKE | 14 | | MILLER RD | 12 | | TRIMBLE HWY HWY | 12 | | BLACKMAN RD | 10 | | GUM RD | 10 | | KINGWOOD LN | 10 | | LASCASSAS PIKE | 10 | | WALNUT GROVE RD RD | 10 | | JEFFERSON PIKE | 8 | | MOUNT HERMAN RD | 8 | | TRENTON ST | 8 | | WEAKLEY LN | 8 | | WOODBURY PIKE | 8 | | BARLOW LN | 6 | | BRADFORD HWY | 6 | | BROWNS MILL RD | 6 | | FACTORY RD | 6 | | FOX STREET | 6 | | HARDY RD RD | 6 | | HICKORY GROVE RD | 6 | | LEBANON PIKE | 6 |
| | | Fire incidents reported |
|---|
| Sreet name | Count |
|---|
| MAIN STREET | 6 | | NORTHERN CHAPEL RD RD | 6 | | RICHLAND RICHARDSON RD | 6 | | ROCKY HILL RD | 6 | | ST RT 5 RT | 6 | | TRENTON | 6 | | TRENTON STREET | 6 | | 840 | 4 | | BAYWOOD AVE | 4 | | BELLS CHAPEL RD | 4 | | BELLS CHAPEL RD RD | 4 | | BIVENS HILL RD | 4 | | BRADFORD HWY | 4 | | BRADYVILLE PIKE | 4 | | CENTRAL VALLEY RD | 4 | | CHARLIE MORRIS ROAD | 4 | | CHINA GROVE RD | 4 | | CHINA GROVE RD RD | 4 | | COUCHVILLE PIKE | 4 | | DINKY LN | 4 | | DOUBLE SPRINGS RD | 4 | | EDDS DRIVE | 4 | | EPPS MILL RD | 4 | | FOSTERVILLE SHORT CREEK RD | 4 | | |
|
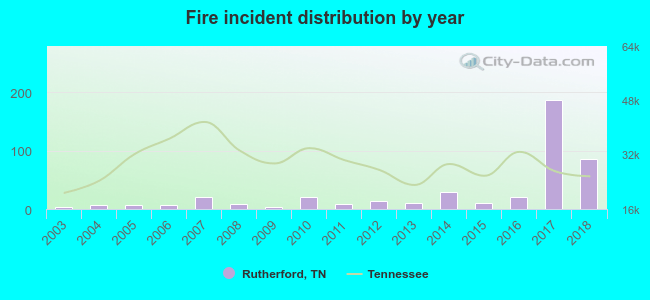 According to the data from the years 2003 - 2018 the average number of fire incidents per year is 28. The highest number of reported fire incidents - 186 took place in 2017, and the least - 3 in 2003. The data has a growing trend.
 31.6% incidents where reported in the morning and 68.4% in the evening. The most fires (18.7%) took place on Saturday, and the least (11.1%) on Tuesday.
 Based on the 443 reports from years 2003 - 2018 most fires (12.2%) took place during January, and the least (5.2%) in September.
 Out of all 5,337 cases reported during the years 2003 - 2018, the most belonged to the categories: Rescue & EMS (52.0%), Good Intent Call (27.4%), and Fire (8.3%).
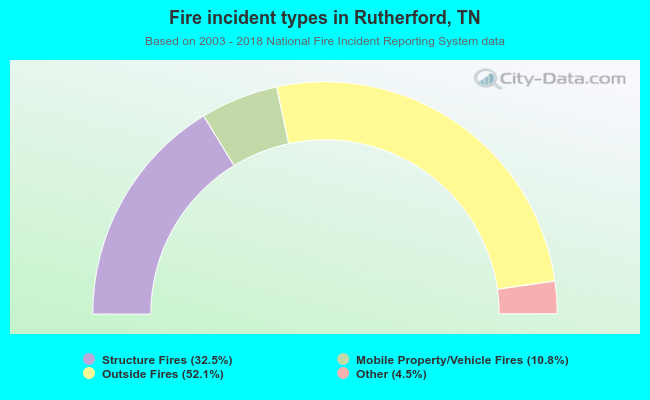 When looking into fire subcategories, the most reports belonged to: Outside Fires (52.1%), and Structure Fires (32.5%).