| Fire incidents reported |
|---|
| Sreet name | Count |
|---|
| RUTLEDGE PIKE | 16 | | GREENLEE RD | 12 | | RUTLEDGE PIKE | 12 | | 92 HWY | 10 | | CENTRAL POINT RD | 10 | | LAKESHORE RD | 10 | | HWY 92 | 8 | | 11W HWY | 6 | | COFFEY LN | 6 | | DUNVILLE GAP RD | 6 | | GREENLEE RD | 6 | | JOE WILLIAMS RD | 6 | | LAKESHORE DR | 6 | | OWL HOLE GAP | 6 | | ROCKY BRANCH RD | 6 | | 165 COFFEY LN | 4 | | 270 GILMORE DOCK LN | 4 | | BECKUM RD | 4 | | BOWEN RD | 4 | | BRYAN RD | 4 | | BUD MORGAN RD | 4 | | CENTRAL POINT | 4 | | CENTRAL POINT RD | 4 | | CHAHOKIA DR | 4 | | CHERRY ST | 4 |
| | | Fire incidents reported |
|---|
| Sreet name | Count |
|---|
| COUNTY HOUSE RD | 4 | | HWY 11-W | 4 | | INDIAN RIDGE RD | 4 | | MAY SPRINGS RD | 4 | | ROACH RD | 4 | | 1025 CARDNAL LN | 2 | | 1043 LESTER JARNIGAN RD | 2 | | 11-W HWY | 2 | | 11270 LAKESHORE DR | 2 | | 1155 CHERRY ST | 2 | | 1168 CORBIN LAKE RD. | 2 | | 1190 ROCKY BRANCH RD | 2 | | 120 LINDA DR | 2 | | 1201 MANLEY RD | 2 | | 12248 HWY 375 | 2 | | 1233 OAK RD | 2 | | 1264 OAK ROAD | 2 | | 131 BYRD RD. | 2 | | 1334 HWY 92 | 2 | | 1353 DUNVILLE GAP RD | 2 | | 139 VOLUNTEER RD | 2 | | 144 METCALF RD. | 2 | | 153 JONES LN | 2 | | 1539 CHERRY ST. | 2 | | |
|
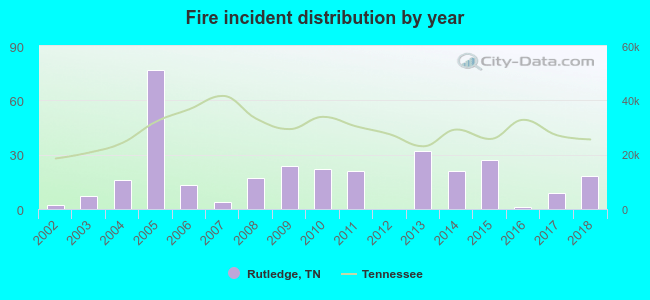 According to the data from the years 2002 - 2018 the average number of fire incidents per year is 18. The highest number of reported fire incidents - 77 took place in 2005, and the least - 0 in 2012. The data has a growing trend.
 38.6% incidents where reported in the morning and 61.4% in the evening. The most fires (17.4%) took place on Monday, and the least (10.3%) on Wednesday.
 Based on the 311 reports from years 2002 - 2018 most fires (12.9%) took place during January, and the least (2.6%) in October.
 Out of all 502 cases reported during the years 2002 - 2018, the most belonged to the categories: Fire (62.0%), Rescue & EMS (20.1%), and Overpressure Rupture (10.2%).
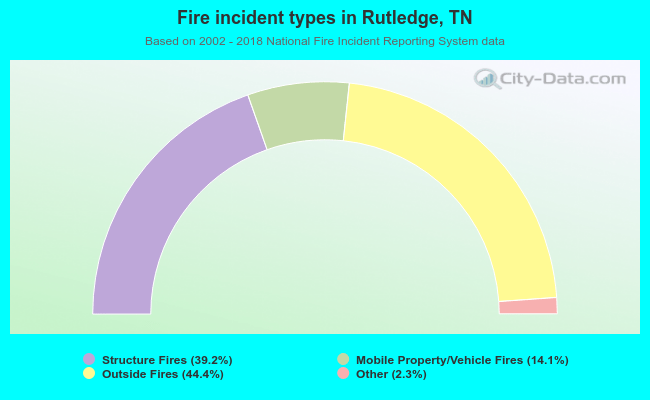 When looking into fire subcategories, the most reports belonged to: Outside Fires (44.4%), and Structure Fires (39.2%).