| Fire incidents reported |
|---|
| Sreet name | Count |
|---|
| MAIN | 12 | | LAKE ROAD | 10 | | 12 BLOCKS E - 3/4 M NORTH | 6 | | 14TH | 6 | | SOUTH LAKE ROAD | 6 | | 128TH AND T ROAD | 4 | | 6TH | 4 | | 8TH | 4 | | FIRST | 4 | | HWY 246 | 4 | | HWY75 | 4 | | OLD HWY 75 | 4 | | OREGON ST | 4 | | T RD | 4 | | 1 BLOCK E 6 BLOCKS N | 2 | | 112 TH | 2 | | 112TH AND S ROAD | 2 | | 117 N 13TH | 2 | | 12 BLOCKS E 6 MILES N | 2 | | 12 BLOCKS EAST 3 BLOCKSS | 2 | | 120TH U ROAD | 2 | | 1220 OREGON ST | 2 | | 124TH RD | 2 | | 124TH ROAD | 2 | | 125 SOUTH 5TH ST | 2 |
| | | Fire incidents reported |
|---|
| Sreet name | Count |
|---|
| 12BLOCKS E 2MILES N | 2 | | 136TH S ROAD | 2 | | 14 ST | 2 | | 144TH AND S ROAD | 2 | | 1650 GRACELAND DR | 2 | | 168 AND S ROAD | 2 | | 1750 MAIN ST | 2 | | 1769 U ROAD | 2 | | 184TH TRD | 2 | | 2 BLKS WEST 6 BLKS N | 2 | | 2 BLOCKS E 8 BLOCKS N | 2 | | 2 MILES W 4 MILES S | 2 | | 208TH ROAD RD | 2 | | 2147 HWY 36 | 2 | | 2148 160TH RD | 2 | | 224TH | 2 | | 225 HWY K246 | 2 | | 2328 124TH ROAD | 2 | | 2587 US 75 HWY | 2 | | 270TH ROAD | 2 | | 320TH | 2 | | 402 HWY K246 | 2 | | 511 GRANT | 2 | | 6 MI SO - 14TH ST | 2 | | |
|
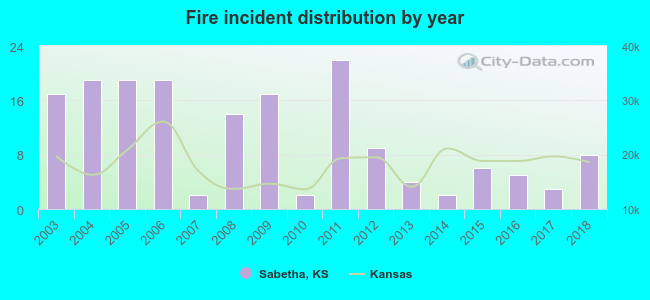 Based on the data from the years 2003 - 2018 the average number of fire incidents per year is 11. The highest number of reported fire incidents - 22 took place in 2011, and the least - 2 in 2007. The data has a decreasing trend.
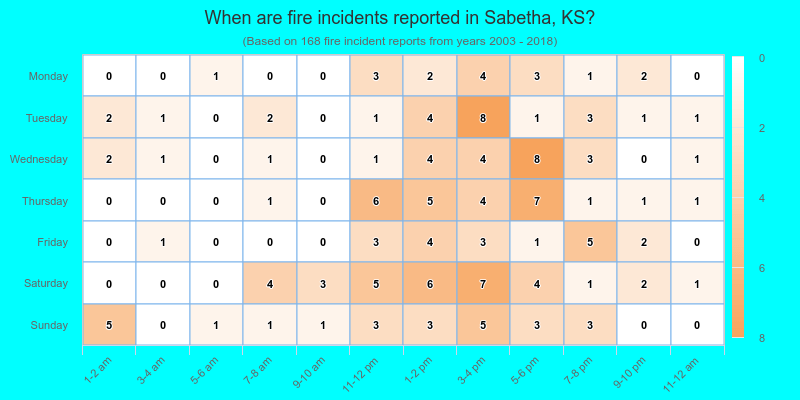
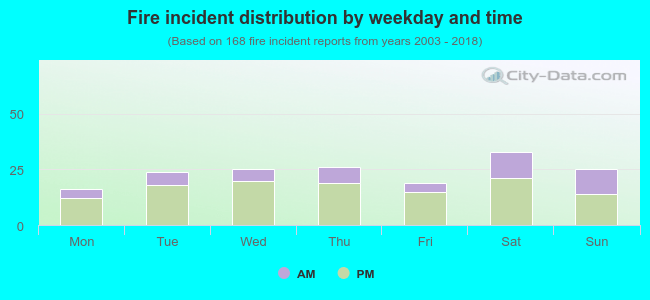 29.2% incidents where reported in the morning and 70.8% in the evening. The most fires (19.6%) took place on Saturday, and the least (9.5%) on Monday.
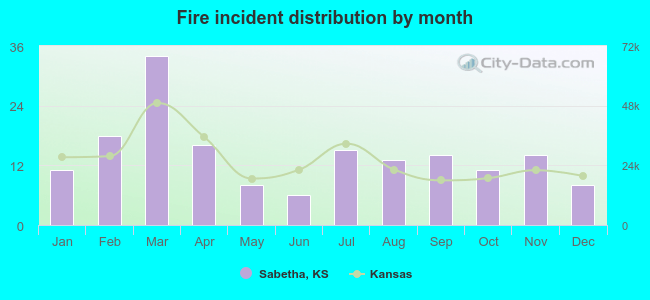 Based on the 168 reports from years 2003 - 2018 most fires (20.2%) took place during March, and the least (3.6%) in June.
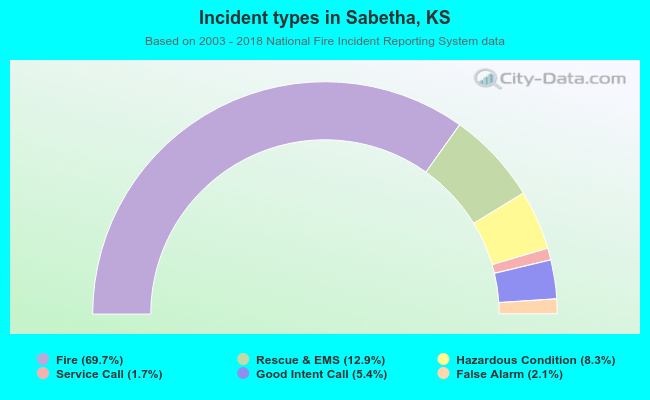 Out of all 241 cases reported during the years 2003 - 2018, the most belonged to the categories: Fire (69.7%), Overpressure Rupture (12.9%), and Rescue & EMS (8.3%).
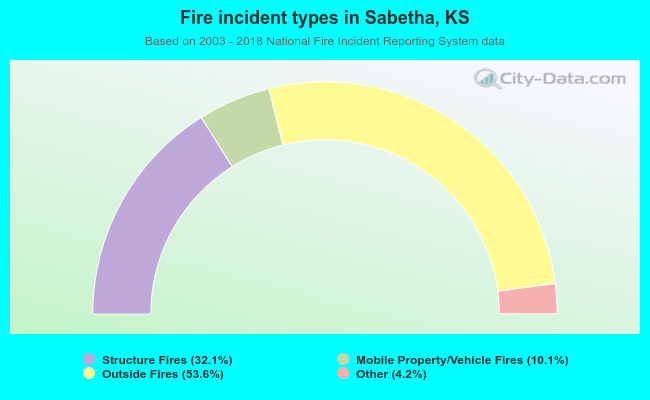 When looking into fire subcategories, the most incidents belonged to: Outside Fires (53.6%), and Structure Fires (32.1%).