| Fire incidents reported |
|---|
| Sreet name | Count |
|---|
| ST RT 72 RT | 38 | | WASHINGTON ST | 36 | | ST RT 22 RT | 34 | | INTERSTATE 71 FWY | 24 | | HOWARD ST | 20 | | ST RT 729 RT | 20 | | US 22 SR 3 EAST | 20 | | COLLEGE ST | 18 | | JACKSON ST | 18 | | SABINA RD | 16 | | STATE ROUTE 72 SOUTH | 16 | | HULSE ST | 14 | | JEFFERSON ST | 14 | | MELVIN RD | 14 | | FLORENCE AVE | 12 | | HORNBEAM RD | 12 | | MOUND ST | 12 | | PARK AVE | 12 | | POLK RD | 12 | | S JACKSON ST | 12 | | SHERMAN ST | 12 | | DAKIN CHAPEL RD | 10 | | LARRICK RD | 10 | | N COLLEGE ST | 10 | | N HOWARD ST | 10 |
| | | Fire incidents reported |
|---|
| Sreet name | Count |
|---|
| REED RD | 10 | | S HOWARD ST | 10 | | SHERMAN ST | 10 | | STATE ROUTE 72 NORTH | 10 | | ZIMMERMAN RD | 10 | | CARTER RD | 8 | | GRAND AVE | 8 | | I-71 / JEFFERSON TWP | 8 | | PARK ST | 8 | | POLK RD | 8 | | 22 RT | 6 | | BURNETT RD | 6 | | E WASHINGTON ST | 6 | | I-71 | 6 | | ORCHARD AVE | 6 | | ORCHARD GROVE RD | 6 | | STATE ROUTE 729 SOUTH | 6 | | STOCKTON AVE | 6 | | STONE RD | 6 | | THORPE RD | 6 | | 72 RT | 4 | | 729 RT | 4 | | BURNETT RD | 4 | | CENTRAL AVE | 4 | | |
|
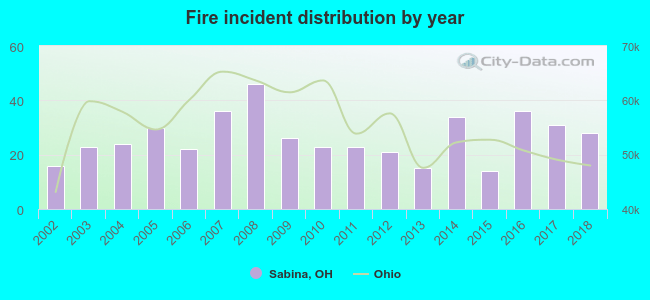 Based on the data from the years 2002 - 2018 the average number of fires per year is 26. The highest number of reported fire incidents - 46 took place in 2008, and the least - 14 in 2015. The data has a growing trend.
 31.9% incidents where reported in the morning and 68.1% in the evening. The most fires (17.9%) took place on Monday, and the least (12.3%) on Wednesday.
 According to the 448 incident reports from years 2002 - 2018 most fires (10.5%) took place during April, and the least (5.8%) in September.
 Out of all 1,785 cases reported during the years 2002 - 2018, the most belonged to the categories: Rescue & EMS (43.0%), Fire (25.1%), and Hazardous Condition (19.6%).
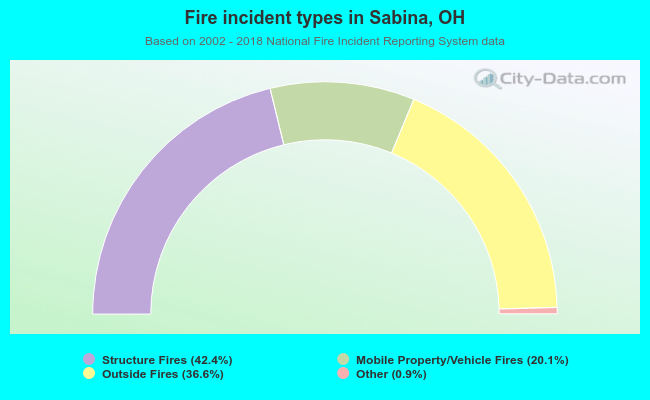 When looking into fire subcategories, the most reports belonged to: Structure Fires (42.4%), and Outside Fires (36.6%).