| Fire incidents reported |
|---|
| Sreet name | Count |
|---|
| HWY 82 | 24 | | FM 901 | 16 | | BROOKS | 10 | | CORDELL RD | 8 | | HWY 901 | 8 | | MAIN ST | 8 | | OLD SHERMAN RD | 8 | | PECAN ST | 8 | | BENNETT LN | 6 | | HWY 56 | 6 | | SPALDING RD | 6 | | SPALDING RD | 6 | | BROOKS LN | 4 | | HACKLMAN RD | 4 | | SADLER | 4 | | SANDUSKY | 4 | | 1000 ARKANSAS RD | 2 | | 1025 ARKANSAS | 2 | | 1046 LEO CARTER | 2 | | 108 N MAIN | 2 | | 1353 CORDELL | 2 | | 142 EARL HUGHES RD | 2 | | 161 EARL RD | 2 | | 1944 CORDELL RD | 2 | | 1977 DIXE RD | 2 |
| | | Fire incidents reported |
|---|
| Sreet name | Count |
|---|
| 200 CORDELL ROAD | 2 | | 207 RAM AVE. | 2 | | 211 CORDELL RD | 2 | | 2568 GREER ROAD | 2 | | 27 FREEMAN ROAD | 2 | | 283 HARSHBARGER RD | 2 | | 28707 HWY 82 LGTS | 2 | | 2966 OLD SHERMAN ROAD | 2 | | 329 MAPUANA RD | 2 | | 3380 OLD SHERMAN | 2 | | 3532 OLD SADLER RD BRUSHY CRE | 2 | | 38 BIG MINERAL | 2 | | 38 PUALOGA | 2 | | 4000 GIBBONS | 2 | | 430 HICKORY CREEK DR | 2 | | 55 ANGELA DR. | 2 | | 569 WEAST PECAN | 2 | | 614 SANDUSKY RD | 2 | | 66 MAVERICK RD | 2 | | 691 EARL RD. | 2 | | 751 HACKLEMAN RD | 2 | | 7735 FM 901 | 2 | | 781 SOUTHMAYD RD | 2 | | 82 HWY | 2 | | |
|
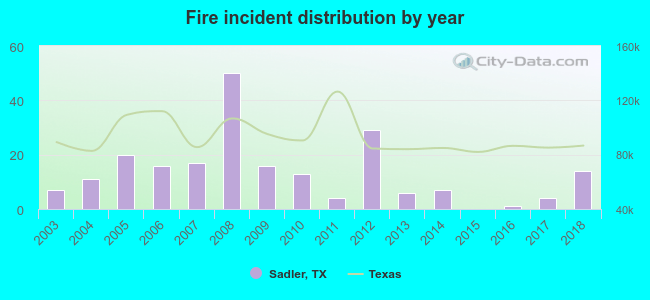 Based on the data from the years 2003 - 2018 the average number of fires per year is 13. The highest number of reported fires - 50 took place in 2008, and the least - 0 in 2015. The data has a growing trend.
 27.4% incidents where reported in the morning and 72.6% in the evening. The most fires (23.7%) took place on Monday, and the least (6.5%) on Thursday.
 According to the 215 reports from years 2003 - 2018 most fires (15.8%) took place during July, and the least (3.7%) in June.
 Out of all 413 cases reported during the years 2003 - 2018, the most belonged to the categories: Fire (52.1%), Overpressure Rupture (19.9%), and Rescue & EMS (18.4%).
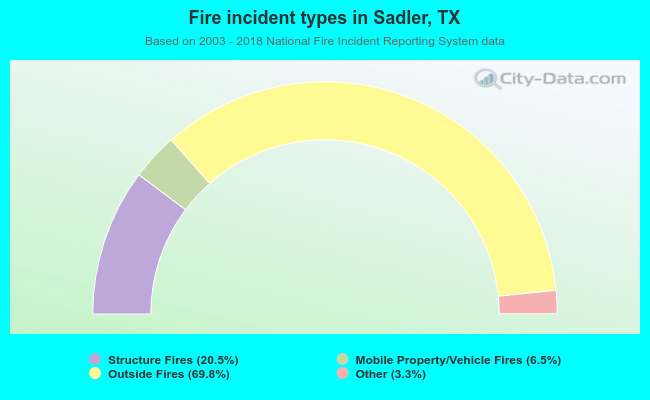 When looking into fire subcategories, the most incidents belonged to: Outside Fires (69.8%), and Structure Fires (20.5%).