| Fire incidents reported |
|---|
| Sreet name | Count |
|---|
| MAIN ST | 20 | | NOYAC RD | 20 | | CLIFF DR | 8 | | BRICK KILN RD | 6 | | DIVISION ST | 6 | | MAIN ST | 6 | | BAY ST | 4 | | BURKE ST | 4 | | CLAY PIT RD | 4 | | COVE DR | 4 | | DIVISION ST | 4 | | DIVISION STREET ST | 4 | | FERRY RD | 4 | | FERRY ROAD | 4 | | JERMAIN AVE | 4 | | JOHN ST | 4 | | MADISON STREET ST | 4 | | MERCHANTS PATH PATH | 4 | | NOYAC ROAD | 4 | | RIDGE RD | 4 | | ROBESON BLVD | 4 | | ROUTE 114 | 4 | | SAG HARBOR TURNPIKE | 4 | | WADES BEACH | 4 | | WHITNEY RD | 4 |
| | | Fire incidents reported |
|---|
| Sreet name | Count |
|---|
| ABERDEEN LA | 2 | | ACKERLY ST | 2 | | ACTORS COLONY ROAD RD | 2 | | BAY AVENUE | 2 | | BAY ST | 2 | | BAY VIEW AVE | 2 | | BEACH PLUM RD | 2 | | BIRCH ST | 2 | | BITTERSWEET LA | 2 | | BLUFF POINT RD | 2 | | BREEZY DR | 2 | | BRICK KILN RD | 2 | | BURKSHIRE DR | 2 | | CAMBRIDGE COURT | 2 | | CARROLL STREET ST | 2 | | CEDAR DRIVE | 2 | | CEDAR DRIVE DR | 2 | | CEDAR POINT LANE | 2 | | CEDAR POINT LN | 2 | | CHESNUT ST | 2 | | CHESTNUT ST | 2 | | CLEARVIEW DR | 2 | | CUFFEE DRIVE DR | 2 | | DANIELS HOLE ROADEAST HAMPTO RD | 2 | | DANIELS LANE LN | 2 |
|
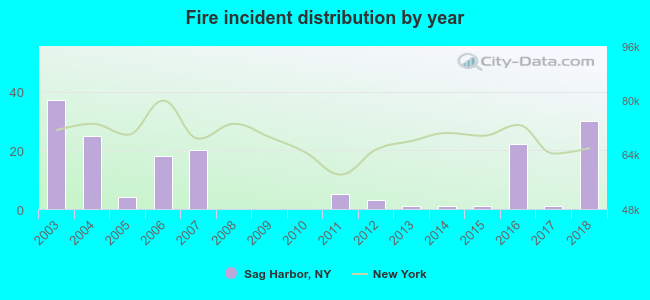 Based on the data from the years 2003 - 2018 the average number of fires per year is 11. The highest number of reported fires - 37 took place in 2003, and the least - 0 in 2008. The data has a decreasing trend.
 32.7% incidents where reported in the morning and 67.3% in the evening. The most fires (17.9%) took place on Saturday, and the least (11.3%) on Tuesday.
 Based on the 168 reports from years 2003 - 2018 most fires (14.3%) took place during March, and the least (2.4%) in October.
 Out of all 1,338 cases reported during the years 2003 - 2018, the most belonged to the categories: Good Intent Call (33.9%), Rescue & EMS (22.6%), and Service Call (13.7%).
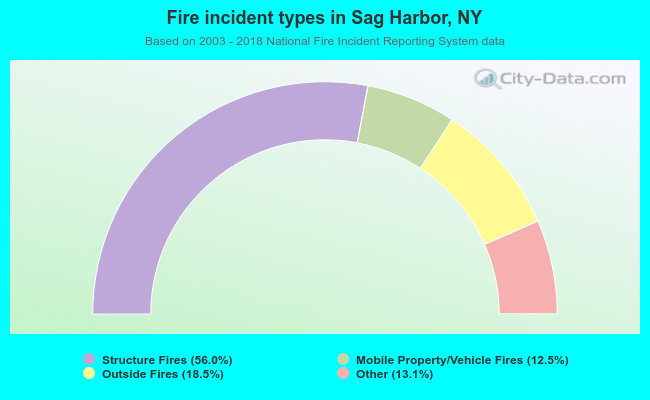 When looking into fire subcategories, the most reports belonged to: Structure Fires (56.0%), and Outside Fires (18.5%).