| Fire incidents reported |
|---|
| Sreet name | Count |
|---|
| STATE ROUTE 22 | 50 | | MAIN ST | 36 | | COUNTY ROUTE 30 | 30 | | STATE ROUTE 29 | 22 | | BROADWAY | 18 | | BLIND BUCK RD | 16 | | COUNTY ROUTE 153 | 16 | | EAST BROADWAY | 12 | | QUARRY RD | 10 | | BLANCHARD ST | 8 | | CHAMBERS RD | 8 | | REAFIELD FARM RD | 8 | | SKELLIE RD | 8 | | SMITH RD | 8 | | STANTON HILL RD | 8 | | WEST BROADWAY | 8 | | BLACK CREEK RD | 6 | | CAMDEN VALLEY RD | 6 | | CEMETERY RD | 6 | | DILLON HILL RD | 6 | | PITTS HILL RD | 6 | | ACKLEY RD | 4 | | BLIND BUCK RD RD | 4 | | COUNTY ROUTE 61 | 4 | | COUNTY ROUTE 64 | 4 |
| | | Fire incidents reported |
|---|
| Sreet name | Count |
|---|
| CTY RT 30 | 4 | | FERGUSON LANE | 4 | | JAMES RD | 4 | | MCDOUGAL LAKE RD | 4 | | NORTH ST | 4 | | PRIEST RD | 4 | | REXLEIGH RD | 4 | | RILEY HILL RD | 4 | | ROUTE 313 | 4 | | SPORTSMAN WAY | 4 | | STAMPS WAY | 4 | | STATE ROUTE 22NORTH | 4 | | STATE ROUTE 29 HWY | 4 | | STATE RT 29 | 4 | | STEELE RD | 4 | | 4186 STATE RT 29 | 2 | | ACADEMY ST | 2 | | ARCHIBALD ST | 2 | | ASHGROVE RD | 2 | | AVENUE A | 2 | | BATTENKILL EVERGREENS | 2 | | BEATIE HOLLOW RD | 2 | | BEATTIE HOLLOW RD | 2 | | BLIND BUCK | 2 | | BLINDBUCK RD | 2 |
|
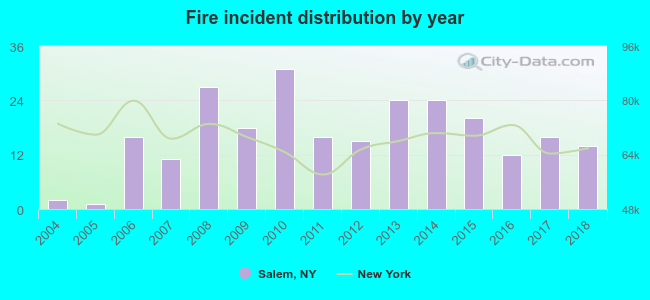 Based on the data from the years 2004 - 2018 the average number of fires per year is 16. The highest number of fire incidents - 31 took place in 2010, and the least - 1 in 2005. The data has a rising trend.
 27.1% incidents where reported in the morning and 72.9% in the evening. The most fires (18.2%) took place on Thursday, and the least (10.9%) on Tuesday.
 Based on the 247 reports from years 2004 - 2018 most fires (19.0%) took place during April, and the least (4.0%) in June.
 Out of all 715 cases reported during the years 2004 - 2018, the most belonged to the categories: Fire (34.5%), Hazardous Condition (34.1%), and Rescue & EMS (16.4%).
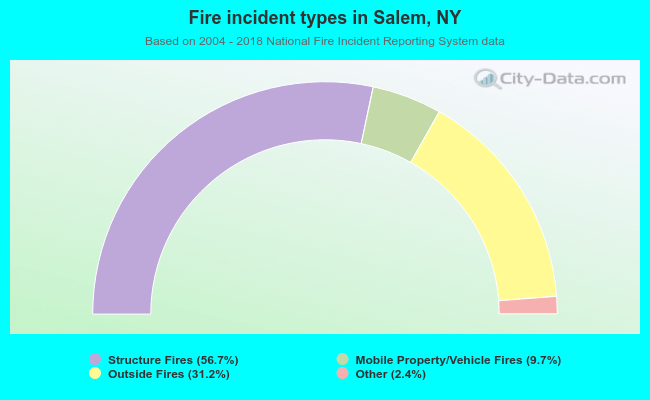 When looking into fire subcategories, the most incidents belonged to: Structure Fires (56.7%), and Outside Fires (31.2%).