| Fire incidents reported |
|---|
| Sreet name | Count |
|---|
| ROUTE 94 | 26 | | LAKE RD | 18 | | CLOVE RD | 10 | | ORRS MILLS RD | 8 | | BRIAN CT CT | 6 | | MECCA DR | 6 | | STATION RD | 6 | | WOODCOCK MOUNTAIN RD | 6 | | CEDAR TRAIL | 4 | | HILL RD | 4 | | LYNMORE AVE | 4 | | NANUWITT LANE | 4 | | PINE CREST DR | 4 | | SCHOOLHOUSE RD | 4 | | THOMPSON DR | 4 | | UNDERHILL TRAIL | 4 | | ALDER DR | 2 | | ALPHONSO COURT | 2 | | ANN MARIE DR | 2 | | CEDAR | 2 | | EMERALD TRAIL TRL | 2 | | GLENWOOD ROAD | 2 | | GRANDVIEW | 2 | | GRANDVIEW TRAIL | 2 | | HIGHVIEW DR | 2 |
| | | Fire incidents reported |
|---|
| Sreet name | Count |
|---|
| HILLCREST DR | 2 | | HILLCREST TRL | 2 | | KIRSTEN LEAH LANE | 2 | | LAKEVIEW TRL | 2 | | LENAPE LA | 2 | | LUCKY LANE | 2 | | LYNMORE DR | 2 | | MEADOW CT | 2 | | MOHECAN CT | 2 | | MORRIS LA | 2 | | MOUNT LODGE PARK | 2 | | MOUNTAIN LODGE PARK PARK | 2 | | MOUNTAIN LODGE PARK PKY | 2 | | MOUNTAIN LODGE ROAD RD | 2 | | NATCHU CT | 2 | | OAK DR | 2 | | OAKLAND TRAIL NORTH | 2 | | OTTERKILL RD | 2 | | PARADISE | 2 | | PENNY LANE | 2 | | SAULSBURY MILLS FIRE DIST | 2 | | SCENIC DR | 2 | | SCHUNNEMUNK MTN | 2 | | SHORE ROAD RD | 2 | | SUMMIT TRAIL TRL | 2 |
|
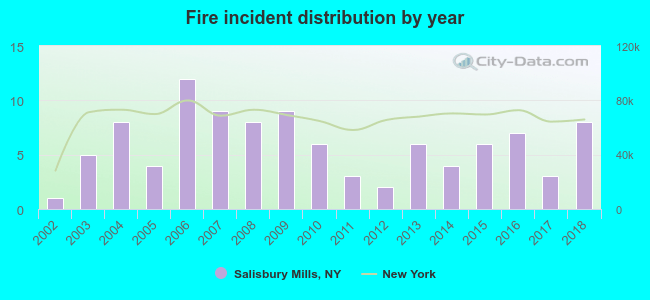 Based on the data from the years 2002 - 2018 the average number of fires per year is 6. The highest number of fire incidents - 12 took place in 2006, and the least - 1 in 2002. The data has a rising trend.
 32.7% incidents where reported in the morning and 67.3% in the evening. The most fires (18.8%) took place on Sunday, and the least (7.9%) on Thursday.
 Based on the 101 reports from years 2002 - 2018 most fires (13.9%) took place during February, and the least (3.0%) in November.
 Out of all 440 cases reported during the years 2002 - 2018, the most belonged to the categories: Fire (23.0%), Overpressure Rupture (22.5%), and Rescue & EMS (22.3%).
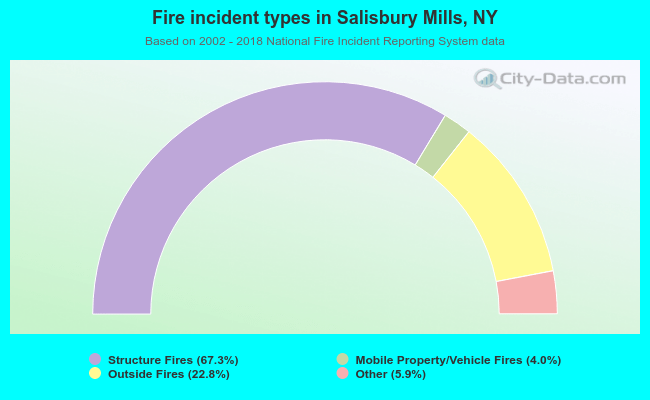 When looking into fire subcategories, the most incidents belonged to: Structure Fires (67.3%), and Outside Fires (22.8%).