| Fire incidents reported |
|---|
| Sreet name | Count |
|---|
| 1204 MANOR DRIVE | 6 | | 25500 PRARIE VALLEY AVE | 6 | | 29916 HWY 129 | 6 | | 310 W 2ND | 6 | | 580 HWY 129 | 6 | | 117 W FOURTH | 4 | | 25651 PRARIE VALLEY AVE | 4 | | 304 W FRONT | 4 | | 307 W FRONT | 4 | | 308 W 2ND | 4 | | 309 WEST STREET | 4 | | 34842 FLOYD PARKS ROAD | 4 | | 37000 BLK HWY 24 | 4 | | 39769 CATTLE LANE | 4 | | 401 S WEBER | 4 | | 40515 SILVER CROSSING RD | 4 | | 408 N WEBER | 4 | | 501 S BIRCH | 4 | | 623 S GRAND | 4 | | 902 MANOR DRIVE | 4 | | BARTH AVENUE | 4 | | BYNUM RD | 4 | | CHAPEL HILL RD | 4 | | HWY 24 | 4 | | MARKET LANE | 4 |
| | | Fire incidents reported |
|---|
| Sreet name | Count |
|---|
| 1002 S. MAPLE | 2 | | 103 W 7TH | 2 | | 104 S EDSON | 2 | | 105 MELODY LANE | 2 | | 105 N EDSON | 2 | | 105 W 8TH | 2 | | 1117 S WEBER | 2 | | 116 W HWY 24 | 2 | | 117 W 3RD | 2 | | 120 HIGHWAY 24 WEST | 2 | | 120 W HWY 24 | 2 | | 13169 HIGHWAY DD | 2 | | 13655 HWY 129 | 2 | | 14189 BEE BRANCH AVE | 2 | | 15825 CEDAR RIDGE AVE | 2 | | 16227 HWY 129 | 2 | | 16448 CHESTNUT AVE | 2 | | 16464 CEDAR RIDGE | 2 | | 16718 HIGHWAY 129 | 2 | | 16729 BARTH AVENUE LGTS | 2 | | 17850 KENNEL LANE | 2 | | 18585 GLEE RD | 2 | | 201 E 9TH | 2 | | 201 S ALICE | 2 | | |
|
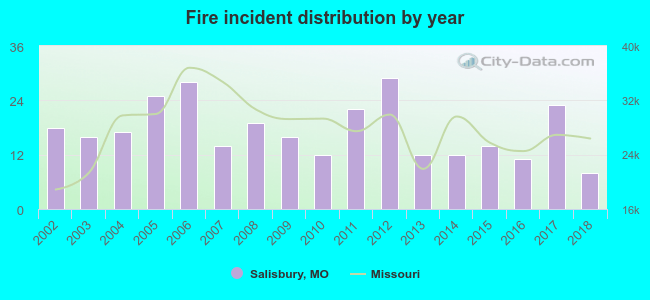 Based on the data from the years 2002 - 2018 the average number of fire incidents per year is 17. The highest number of fire incidents - 29 took place in 2012, and the least - 8 in 2018. The data has a decreasing trend.
 34.1% incidents where reported in the morning and 65.9% in the evening. The most fires (16.6%) took place on Monday, and the least (10.1%) on Thursday.
 According to the 296 fires from years 2002 - 2018 most fires (16.2%) took place during March, and the least (4.4%) in December.
 Out of all 576 cases reported during the years 2002 - 2018, the most belonged to the categories: Fire (51.4%), Hazardous Condition (32.1%), and Rescue & EMS (9.2%).
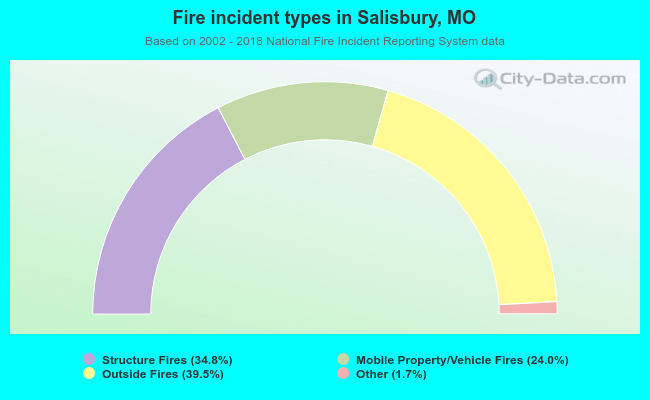 When looking into fire subcategories, the most incidents belonged to: Outside Fires (39.5%), and Structure Fires (34.8%).