San Luis: Fire Incidents, Arizona (AZ)
Where are fire incidents reported in San Luis, AZ
Something went wrong! Please refresh the page.
|
| |||||||||||||||||||||||||||||||||||||||||||||||||||||||||||||||||||||||||||||||||||||||||||||||||||||||||||||
2003 - 2018 National Fire Incident Reporting System (NFIRS) incidents
- Incident types reported to NFIRS in San Luis, AZ
- 13,21882.0%Rescue & EMS
- 1,5719.8%Service Call
- 5923.7%Good Intent Call
- 3752.3%Fire
- 1861.2%False Alarm
- 1641.0%Hazardous Condition
- Fire incident types reported to NFIRS in San Luis, AZ
- 12533.3%Outside Fires
- 11630.9%Mobile Property/Vehicle Fires
- 10828.8%Structure Fires
- 266.9%Other
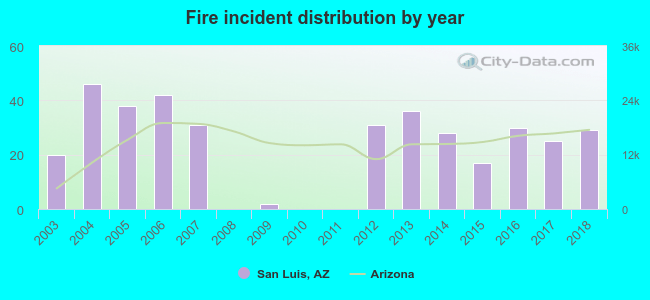 According to the data from the years 2003 - 2018 the average number of fire incidents per year is 23. The highest number of reported fires - 46 took place in 2004, and the least - 0 in 2008. The data has an increasing trend.

 34.7% incidents where reported in the morning and 65.3% in the evening. The most fires (18.1%) took place on Monday, and the least (10.4%) on Thursday.
 According to the 375 reports from years 2003 - 2018 most fires (10.7%) took place during March, and the least (6.1%) in September.
 Out of all 16,110 cases reported during the years 2003 - 2018, the most belonged to the categories: Rescue & EMS (82.0%), Service Call (9.8%), and Good Intent Call (3.7%).
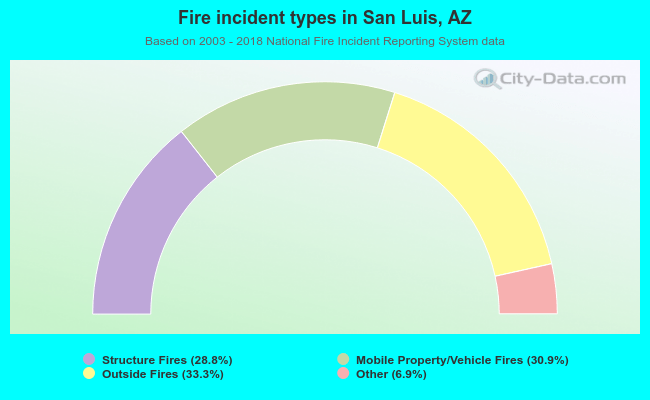 When looking into fire subcategories, the most reports belonged to: Outside Fires (33.3%), and Mobile Property/Vehicle Fires (30.9%).