Sands Point: Fire Incidents, New York (NY)
Where are fire incidents reported in Sands Point, NY
Something went wrong! Please refresh the page.
|
| |||||||||||||||||||||||||||||||||||||||||||||||||||||||||||||||||||||||||||||||||||||||||||||||||||||||||||||
2006 - 2018 National Fire Incident Reporting System (NFIRS) incidents
- Incident types reported to NFIRS in Sands Point, NY
- 36034.5%Hazardous Condition
- 31430.1%False Alarm
- 17216.5%Fire
- 15214.6%Rescue & EMS
- 313.0%Service Call
- 141.3%Good Intent Call
- Fire incident types reported to NFIRS in Sands Point, NY
- 14383.1%Structure Fires
- 1810.5%Outside Fires
- 84.7%Mobile Property/Vehicle Fires
- 31.7%Other
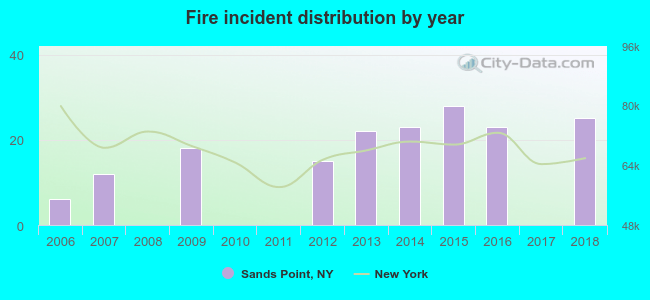 Based on the data from the years 2006 - 2018 the average number of fires per year is 13. The highest number of fire incidents - 28 took place in 2015, and the least - 0 in 2008. The data has a rising trend.
 Based on the reports from the years 2006 - 2018 the average number of fire-related casualties per year is 0. The highest number of reported injuries - 1 took place in 2006, and the lowest - 0 in 2008. The data has a decreasing trend.
 26.2% incidents where reported in the morning and 73.8% in the evening. The most fires (21.5%) took place on Sunday, and the least (9.3%) on Friday.
 Based on the 172 fire incident reports from years 2006 - 2018 most fires (12.2%) took place during September, and the least (4.1%) in January.
 Out of all 1,044 cases reported during the years 2006 - 2018, the most belonged to the categories: Rescue & EMS (34.5%), Good Intent Call (30.1%), and Fire (16.5%).
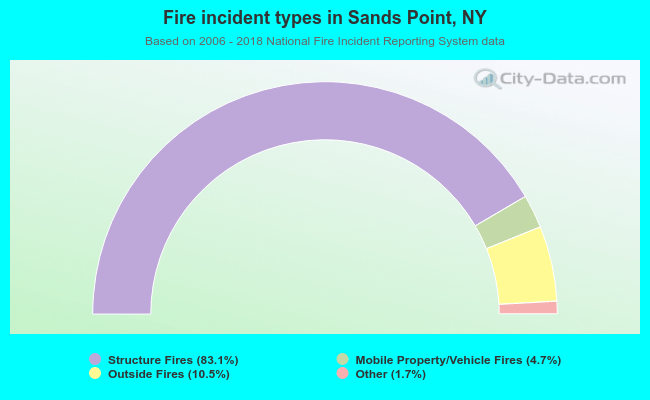 When looking into fire subcategories, the most incidents belonged to: Structure Fires (83.1%), and Outside Fires (10.5%).