Sandy Springs: Fire Incidents, Georgia (GA)
Where are fire incidents reported in Sandy Springs, GA
Something went wrong! Please refresh the page.
| Fire incidents reported | |
|---|---|
| Sreet name | Count |
| ROSWELL RD | 796 |
| I 285 | 148 |
| PEACHTREE DUNWOODY RD | 142 |
| GLENRIDGE DR | 104 |
| HAMMOND DR | 74 |
| ROBERTS DR | 74 |
| JOHNSON FERRY RD | 68 |
| STATE 400 HWY | 66 |
| NORTHRIDGE RD | 64 |
| GEORGIA 400 | 62 |
| MOUNT VERNON HWY | 56 |
| NORTHWOOD DR | 54 |
| 285EB | 50 |
| ABERNATHY RD | 48 |
| SPALDING DR | 46 |
| I285 HWY | 42 |
| COLQUITT RD | 40 |
| NORTHSIDE DR | 40 |
| 285WB | 38 |
| POWERS FERRY RD | 38 |
| SPRING CREEK LN | 38 |
| 400NB | 36 |
| DUNWOODY PL | 36 |
| MORGAN FALLS RD | 34 |
| SANDALWOOD DR | 34 |
| I285 | 32 |
| BRENTWOOD WAY | 30 |
| CEDAR RUN | 30 |
| GLENLAKE | 30 |
| LAKE FORREST DR | 26 |
2008 - 2018 National Fire Incident Reporting System (NFIRS) incidents
- Incident types reported to NFIRS in Sandy Springs, GA
- 16,06135.0%Rescue & EMS
- 15,56133.9%Good Intent Call
- 4,78910.4%Service Call
- 3,8248.3%False Alarm
- 3,5087.6%Hazardous Condition
- 2,1154.6%Fire
- 530.1%Overpressure Rupture
- Fire incident types reported to NFIRS in Sandy Springs, GA
- 82238.9%Structure Fires
- 75335.6%Outside Fires
- 53325.2%Mobile Property/Vehicle Fires
- 70.3%Other
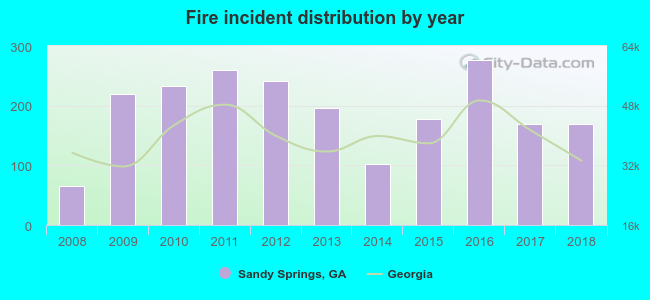 Based on the data from the years 2008 - 2018 the average number of fires per year is 192. The highest number of fires - 276 took place in 2016, and the least - 66 in 2008. The data has a growing trend.
The average number of yearly fire incidents per 10k residents in Sandy Springs, GA compared to nearest cities:
(Note: Based on data for the last 3 years, including only cities with population 5,000 and above)
| Sandy Springs: | 20.1 |
| Dunwoody: | 5.3 |
| Chamblee: | 34.8 |
| Doraville: | 21.8 |
| Roswell: | 18.7 |
| Norcross: | 137.6 |
| Smyrna: | 30.3 |
| Marietta: | 90.3 |
| Tucker: | 29.4 |
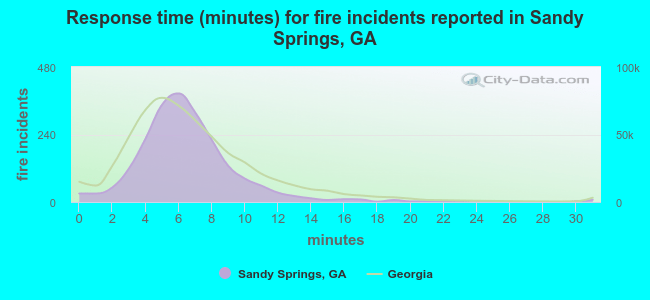 The median response time based on all reported fire incidents is 6 minutes. This is comparable to the Georgia median value.
The median response time in Sandy Springs, GA compared to nearest cities:
(Note: Based on data for all years, including only cities with at least 500 fire incidents)
| Sandy Springs: | 6 minutes |
| Chamblee: | 7 minutes |
| Roswell: | 6 minutes |
| Norcross: | 7 minutes |
| Smyrna: | 5 minutes |
| Marietta: | 6 minutes |
| Tucker: | 6 minutes |
| Alpharetta: | 5 minutes |
| Clarkston: | 6 minutes |
 Based on the reports from the years 2008 - 2018 the average number of fire-related yearly casualties is 1. The highest number of reported injuries - 5 took place in 2009, and the lowest - 0 in 2008. The data has a rising trend.
The average number of casualties per 1,000 fires is 6. This indicator was the highest - 23 in 2009, and the lowest 0 in 2008. The trend for injuries per 1,000 fire incidents is rising. Compared to the state value the number of casualties per 1,000 incidents is lower.
Based on the reports from the years 2008 - 2018 the average number of fire-related yearly casualties is 1. The highest number of reported injuries - 5 took place in 2009, and the lowest - 0 in 2008. The data has a rising trend.
The average number of casualties per 1,000 fires is 6. This indicator was the highest - 23 in 2009, and the lowest 0 in 2008. The trend for injuries per 1,000 fire incidents is rising. Compared to the state value the number of casualties per 1,000 incidents is lower.
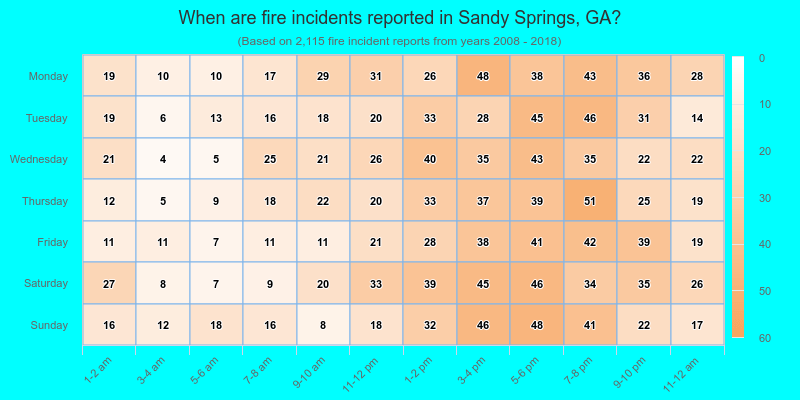
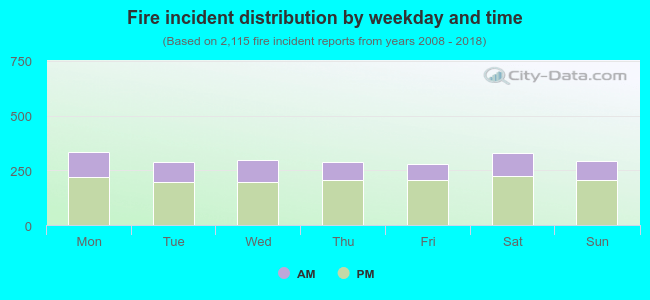 31.2% incidents where reported in the morning and 68.8% in the evening. The most fires (15.8%) took place on Monday, and the least (13.2%) on Friday.
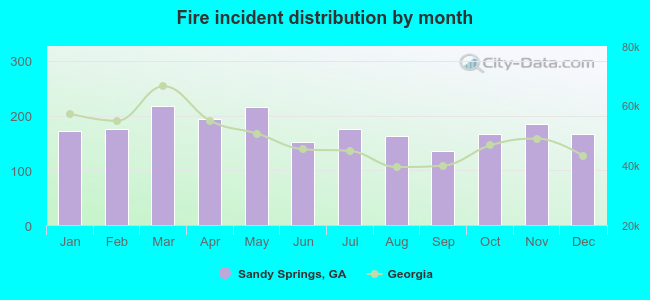 According to the 2,115 fire incident reports from years 2008 - 2018 most fires (10.3%) took place during March, and the least (6.4%) in September.
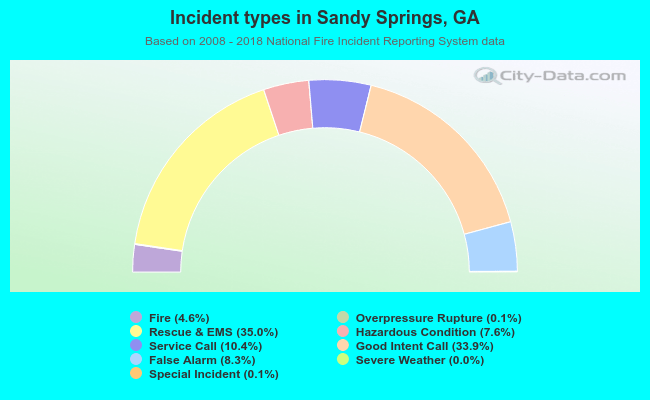 Out of all 45,949 cases reported during the years 2008 - 2018, the most belonged to the categories: Rescue & EMS (35.0%), Good Intent Call (33.9%), and Service Call (10.4%).
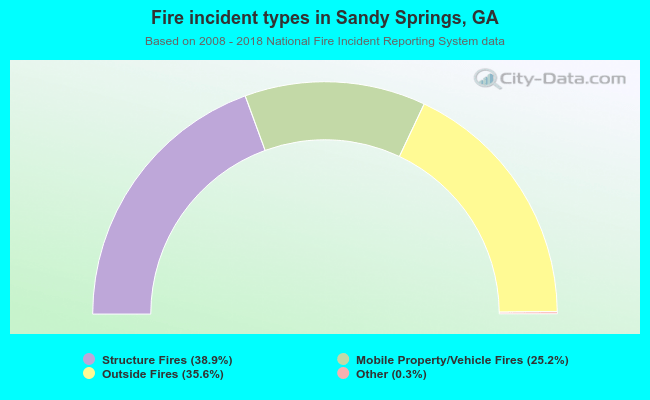 When looking into fire subcategories, the most incidents belonged to: Structure Fires (38.9%), and Outside Fires (35.6%).