Sartell: Fire Incidents, Minnesota (MN)
Where are fire incidents reported in Sartell, MN
Something went wrong! Please refresh the page.
|
| |||||||||||||||||||||||||||||||||||||||||||||||||||||||||||||||||||||||||||||||||||||||||||||||||||||||||||||
2002 - 2018 National Fire Incident Reporting System (NFIRS) incidents
- Incident types reported to NFIRS in Sartell, MN
- 39632.8%Fire
- 37230.8%Hazardous Condition
- 16613.7%False Alarm
- 12210.1%Good Intent Call
- 947.8%Rescue & EMS
- 453.7%Service Call
- 100.8%Severe Weather
- 30.2%Overpressure Rupture
- Fire incident types reported to NFIRS in Sartell, MN
- 18546.7%Structure Fires
- 10225.8%Outside Fires
- 6516.4%Mobile Property/Vehicle Fires
- 4411.1%Other
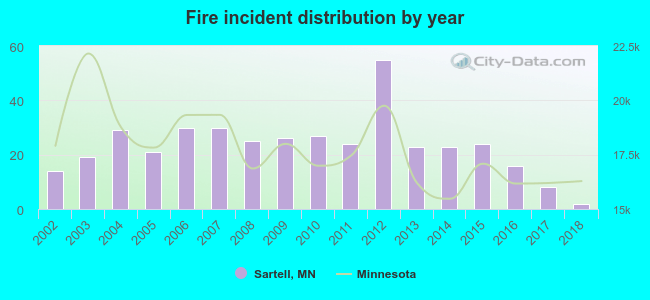 According to the data from the years 2002 - 2018 the average number of fire incidents per year is 23. The highest number of reported fires - 55 took place in 2012, and the least - 2 in 2018. The data has a dropping trend.
The average number of yearly fire incidents per 10k residents in Sartell, MN compared to nearest cities:
(Note: Based on data for the last 3 years, including only cities with population 5,000 and above)
| Sartell: | 5.2 |
| Sauk Rapids: | 19.7 |
| Waite Park: | 56.7 |
| Little Falls: | 74.4 |
| Big Lake: | 31.9 |
| Monticello: | 29.2 |
| Zimmerman: | 82.4 |
| Buffalo: | 25.6 |
| Elk River: | 24.0 |
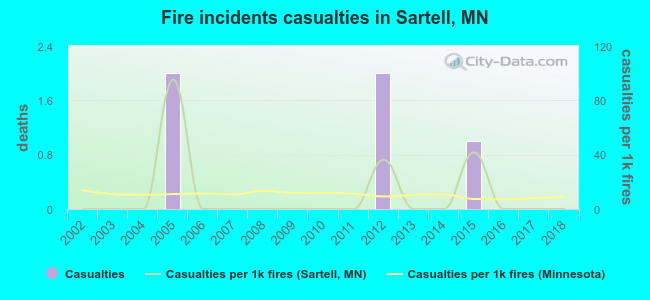 According to the data from the years 2002 - 2018 the average number of fire-related casualties per year is 0. The highest number of casualties - 2 took place in 2005, and the lowest - 0 in 2002. The data has a constant trend.
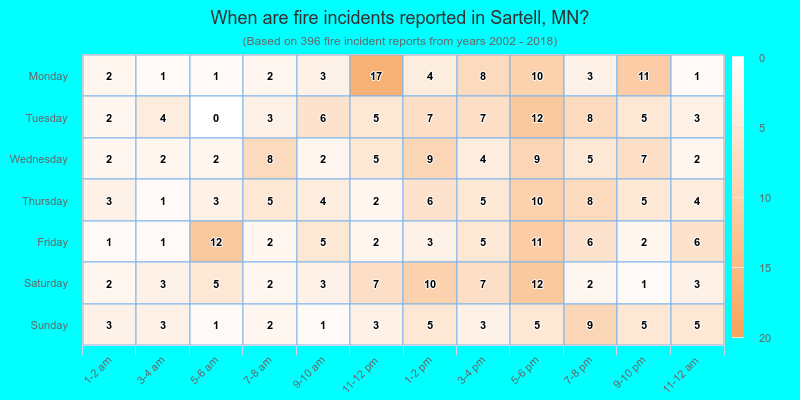
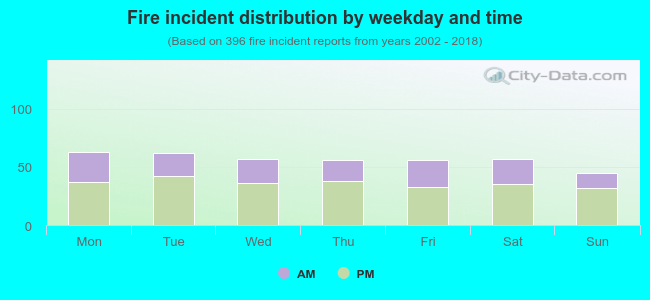 36.1% incidents where reported in the morning and 63.9% in the evening. The most fires (15.9%) took place on Monday, and the least (11.4%) on Sunday.
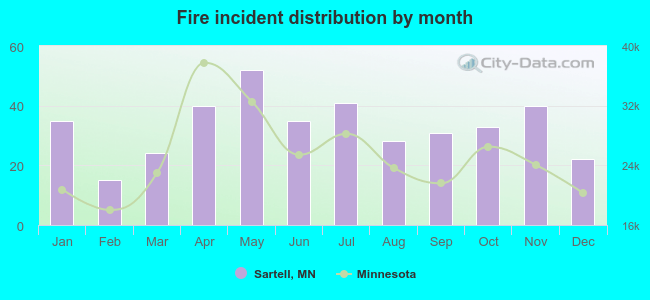 Based on the 396 fire incidents from years 2002 - 2018 most fires (13.1%) took place during May, and the least (3.8%) in February.
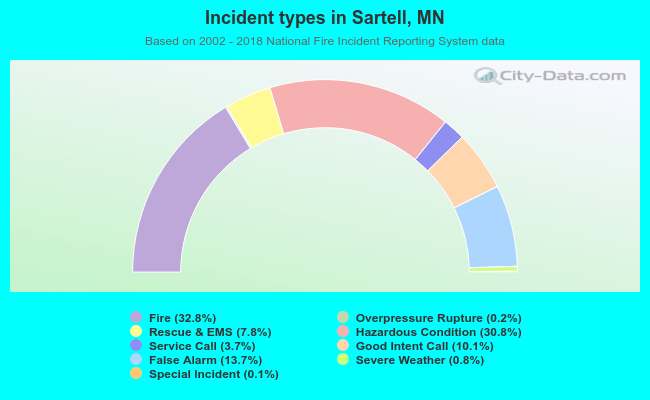 Out of all 1,209 cases reported during the years 2002 - 2018, the most belonged to the categories: Fire (32.8%), Hazardous Condition (30.8%), and False Alarm (13.7%).
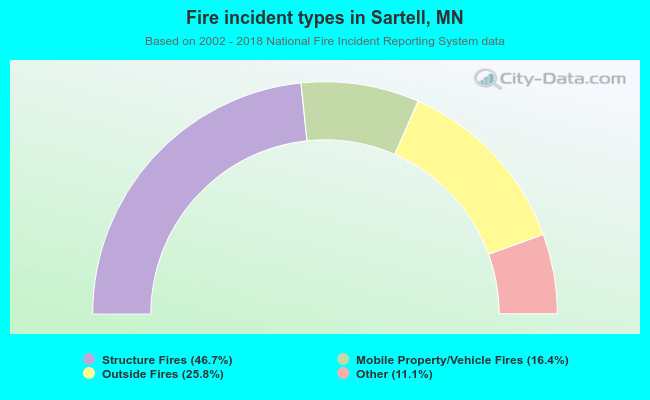 When looking into fire subcategories, the most incidents belonged to: Structure Fires (46.7%), and Outside Fires (25.8%).