| Fire incidents reported |
|---|
| Sreet name | Count |
|---|
| M-129 | 16 | | 5 MILE RD | 10 | | MAPLE ST | 10 | | SHUNK RD | 10 | | CEDAR ST | 8 | | EASTERDAY AVE | 8 | | M-129 HWY | 8 | | MACKINAW TRL | 6 | | PORTAGE AVE | 6 | | SPRUCE ST | 6 | | 11 MILE AND FOREST SIDE RD. | 4 | | 27TH AVE | 4 | | 3239 W 9 MILE RD | 4 | | ASHMUN ST | 4 | | BAKERSIDE RD | 4 | | I-75 | 4 | | I-75 BUSINESS SPUR | 4 | | KIMBALL ST | 4 | | RADAR RD | 4 | | RIVERSIDE DR | 4 | | SCENIC DR | 4 | | SUPERIOR ST | 4 | | WOODFIELD BLVD | 4 | | 100 BLK RIDGE ST | 2 | | 10146 S. WILSON RD. | 2 |
| | | Fire incidents reported |
|---|
| Sreet name | Count |
|---|
| 10244 MACKINAW TRAIL | 2 | | 10288 S MACKINAW TRAIL | 2 | | 1057 E 7 MILE RD | 2 | | 10625 US/2 | 2 | | 1125 ALLEN LANE | 2 | | 11455 S FOREST RD | 2 | | 12075 Z RD | 2 | | 12134 S. BALSAM | 2 | | 12449 S MACKINAC TRAIL | 2 | | 12449 S. MACKINAC TRAIL | 2 | | 12449 S.MACKINAW TRAIL | 2 | | 12678 S. MACKINAW TRAIL | 2 | | 13 MILE AND RIVERSIDE | 2 | | 1314 E. 7 MILE | 2 | | 13213 S. MACKINAC TRAIL | 2 | | 13545 S MACKINAW TRAIL | 2 | | 14200 S. RIVERSIDE | 2 | | 1445 POLARIS DR. | 2 | | 15 MILE AND RIDGE RD. | 2 | | 15 MILE RD | 2 | | 1708 MERIDIAN ST. | 2 | | 1737 S. 12 MILE | 2 | | 1737 W. 12 MILE RD | 2 | | 1834 W 12 MILE RD. | 2 | | |
|
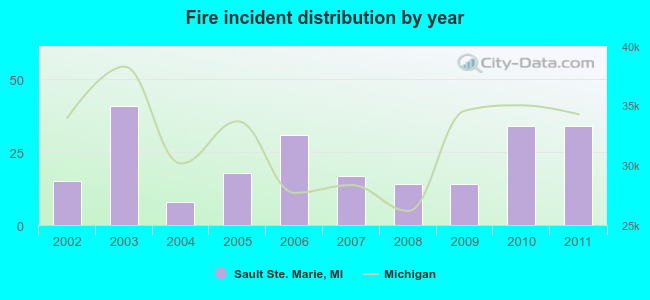 Based on the data from the years 2002 - 2011 the average number of fires per year is 23. The highest number of fire incidents - 41 took place in 2003, and the least - 8 in 2004. The data has a rising trend.
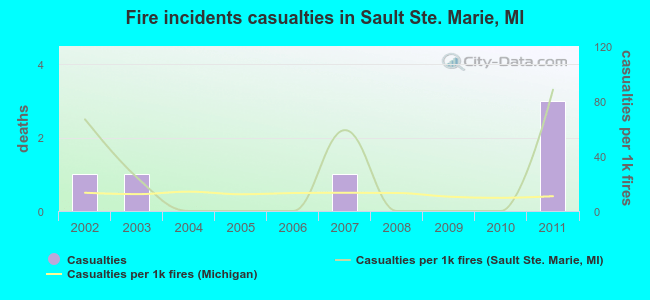 According to the reports from the years 2002 - 2011 the average number of fire-related yearly casualties is 1. The highest number of casualties - 3 took place in 2011, and the lowest - 0 in 2004. The data has a rising trend.
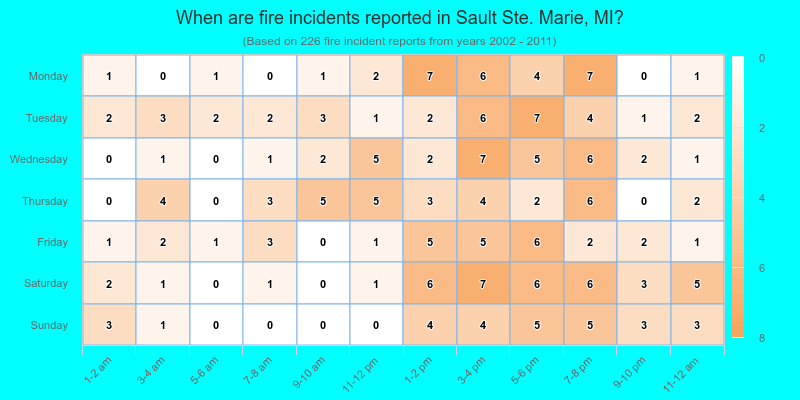
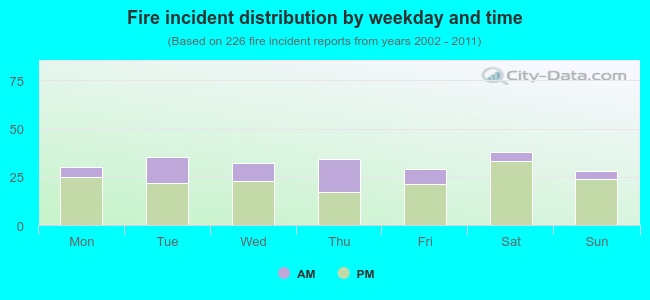 27.0% incidents where reported in the morning and 73.0% in the evening. The most fires (16.8%) took place on Saturday, and the least (12.4%) on Sunday.
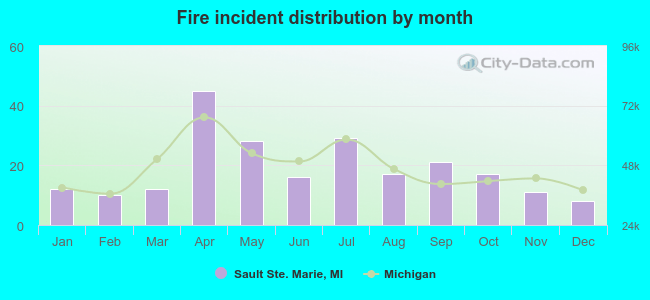 According to the 226 fires from years 2002 - 2011 most fires (19.9%) took place during April, and the least (3.5%) in December.
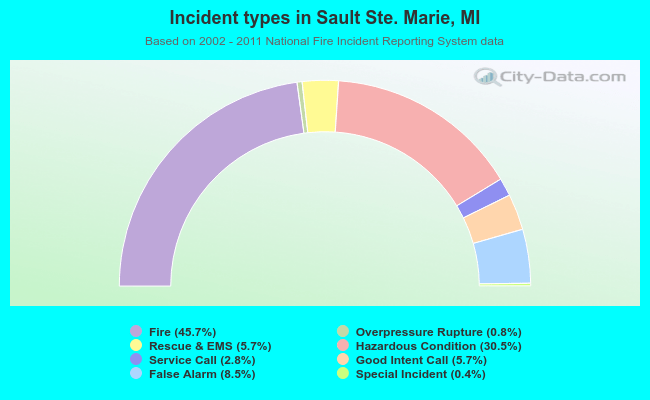 Out of all 495 cases reported during the years 2002 - 2011, the most belonged to the categories: Fire (45.7%), Hazardous Condition (30.5%), and False Alarm (8.5%).
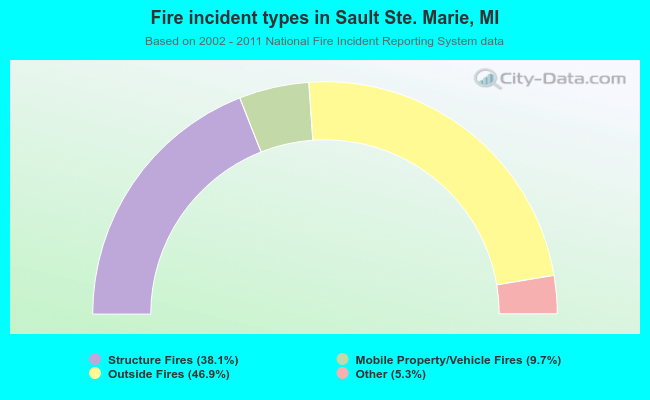 When looking into fire subcategories, the most incidents belonged to: Outside Fires (46.9%), and Structure Fires (38.1%).