Schriever: Fire Incidents, Louisiana (LA)
Where are fire incidents reported in Schriever, LA
Something went wrong! Please refresh the page.
|
| |||||||||||||||||||||||||||||||||||||||||||||||||||||||||||||||||||||||||||||||||||||||||||||||||||||||||||||
2003 - 2018 National Fire Incident Reporting System (NFIRS) incidents
- Incident types reported to NFIRS in Schriever, LA
- 28440.1%Fire
- 16423.1%Rescue & EMS
- 10014.1%Hazardous Condition
- 9613.5%Good Intent Call
- 304.2%Service Call
- 304.2%False Alarm
- 40.6%Overpressure Rupture
- 10.1%Special Incident
- Fire incident types reported to NFIRS in Schriever, LA
- 14952.5%Outside Fires
- 7626.8%Structure Fires
- 5318.7%Mobile Property/Vehicle Fires
- 62.1%Other
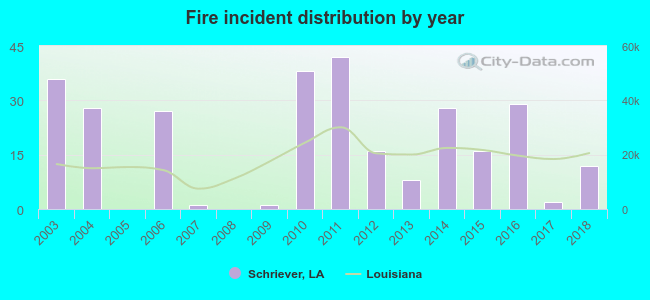 According to the data from the years 2003 - 2018 the average number of fire incidents per year is 18. The highest number of reported fires - 42 took place in 2011, and the least - 0 in 2005. The data has a decreasing trend.
The average number of yearly fire incidents per 10k residents in Schriever, LA compared to nearest cities:
(Note: Based on data for the last 3 years, including only cities with population 5,000 and above)
| Schriever: | 20.9 |
| Thibodaux: | 55.5 |
| Gray: | 16.1 |
| Central: | 0.7 |
| Houma: | 70.9 |
| Raceland: | 64.4 |
| Morgan City: | 8.9 |
| Donaldsonville: | 74.7 |
| Reserve: | 54.6 |
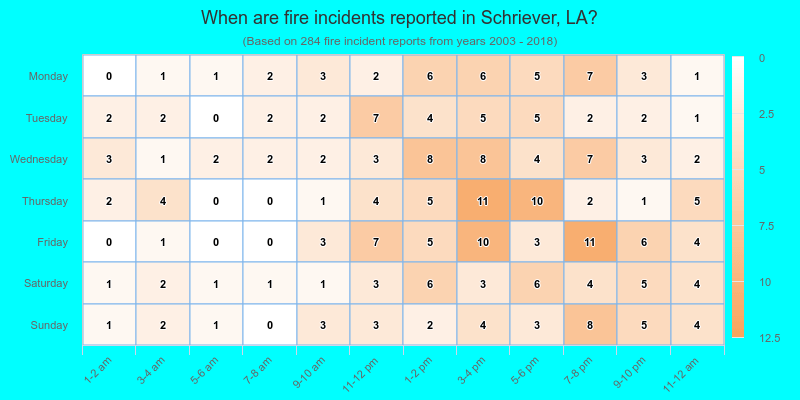
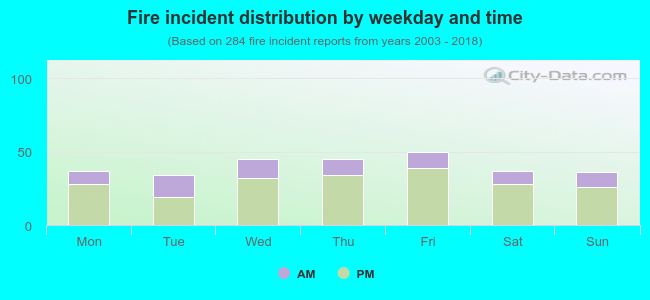 27.5% incidents where reported in the morning and 72.5% in the evening. The most fires (17.6%) took place on Friday, and the least (12.0%) on Tuesday.
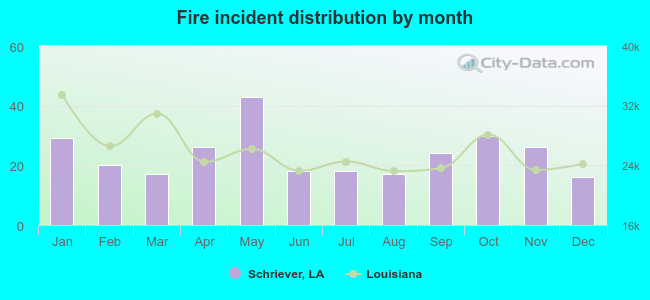 Based on the 284 fire incidents from years 2003 - 2018 most fires (15.1%) took place during May, and the least (5.6%) in December.
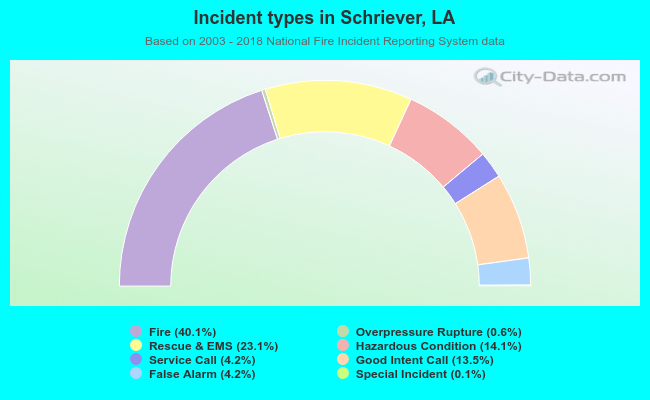 Out of all 709 cases reported during the years 2003 - 2018, the most belonged to the categories: Fire (40.1%), Rescue & EMS (23.1%), and Hazardous Condition (14.1%).
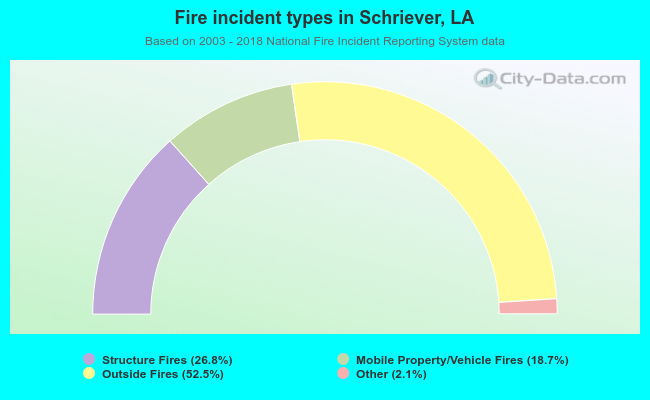 When looking into fire subcategories, the most incidents belonged to: Outside Fires (52.5%), and Structure Fires (26.8%).