Schuylerville: Fire Incidents, New York (NY)
Where are fire incidents reported in Schuylerville, NY
Something went wrong! Please refresh the page.
|
| |||||||||||||||||||||||||||||||||||||||||||||||||||||||||||||||||||||||||||||||||||||||||||||||||||||||||||||
2002 - 2018 National Fire Incident Reporting System (NFIRS) incidents
- Incident types reported to NFIRS in Schuylerville, NY
- 39631.1%Hazardous Condition
- 26420.8%Fire
- 19615.4%Rescue & EMS
- 14011.0%Good Intent Call
- 13710.8%Service Call
- 13510.6%False Alarm
- 20.2%Special Incident
- Fire incident types reported to NFIRS in Schuylerville, NY
- 12848.5%Structure Fires
- 7227.3%Outside Fires
- 5822.0%Mobile Property/Vehicle Fires
- 62.3%Other
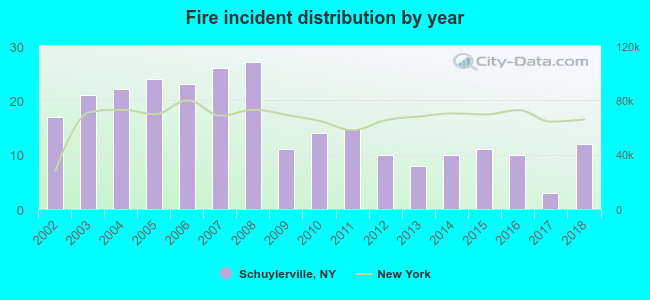 Based on the data from the years 2002 - 2018 the average number of fire incidents per year is 16. The highest number of reported fire incidents - 27 took place in 2008, and the least - 3 in 2017. The data has a dropping trend.
 According to the reports from the years 2002 - 2018 the average number of fire-related casualties per year is 0. The highest number of casualties - 3 took place in 2004, and the lowest - 0 in 2002. The data has a rising trend.
 31.4% incidents where reported in the morning and 68.6% in the evening. The most fires (18.6%) took place on Thursday, and the least (11.4%) on Sunday.
 Based on the 264 fires from years 2002 - 2018 most fires (13.3%) took place during April, and the least (4.2%) in July.
 Out of all 1,272 cases reported during the years 2002 - 2018, the most belonged to the categories: Hazardous Condition (31.1%), Fire (20.8%), and Rescue & EMS (15.4%).
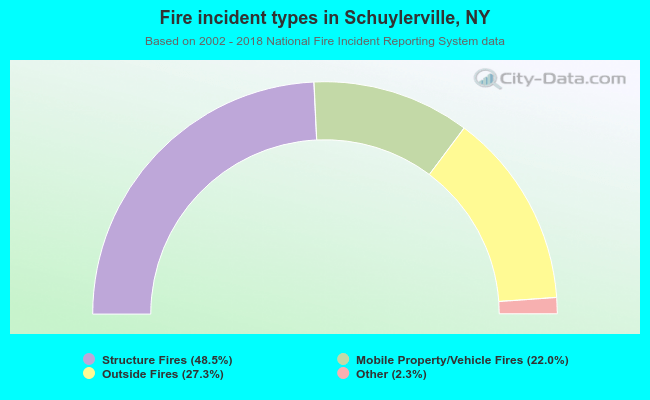 When looking into fire subcategories, the most incidents belonged to: Structure Fires (48.5%), and Outside Fires (27.3%).