Scio: Fire Incidents, Ohio (OH)
Where are fire incidents reported in Scio, OH
Something went wrong! Please refresh the page.
|
| |||||||||||||||||||||||||||||||||||||||||||||||||||||||||||||||||||||||||||||||||||||||||||||||||||||||||||||
2002 - 2018 National Fire Incident Reporting System (NFIRS) incidents
- Incident types reported to NFIRS in Scio, OH
- 48044.4%Fire
- 29327.1%Rescue & EMS
- 13512.5%Hazardous Condition
- 918.4%Good Intent Call
- 565.2%Service Call
- 151.4%False Alarm
- 50.5%Special Incident
- 40.4%Severe Weather
- Fire incident types reported to NFIRS in Scio, OH
- 26956.0%Structure Fires
- 14430.0%Outside Fires
- 5611.7%Mobile Property/Vehicle Fires
- 112.3%Other
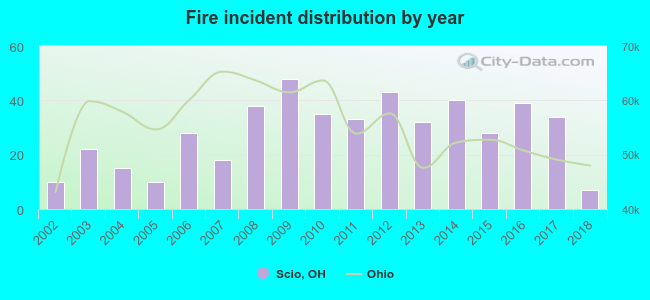 Based on the data from the years 2002 - 2018 the average number of fire incidents per year is 28. The highest number of fire incidents - 48 took place in 2009, and the least - 7 in 2018. The data has a declining trend.
 According to the reports from the years 2002 - 2018 the average number of fire-related yearly casualties is 0. The highest number of casualties - 1 took place in 2014, and the lowest - 0 in 2002. The data has a constant trend.
 34.6% incidents where reported in the morning and 65.4% in the evening. The most fires (17.9%) took place on Friday, and the least (11.3%) on Thursday.
 According to the 480 fires from years 2002 - 2018 most fires (12.3%) took place during November, and the least (4.4%) in August.
 Out of all 1,080 cases reported during the years 2002 - 2018, the most belonged to the categories: Fire (44.4%), Rescue & EMS (27.1%), and Hazardous Condition (12.5%).
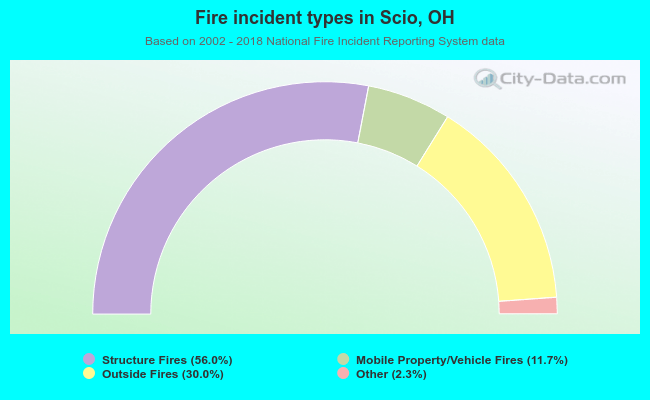 When looking into fire subcategories, the most incidents belonged to: Structure Fires (56.0%), and Outside Fires (30.0%).