Scott City: Fire Incidents, Kansas (KS)
Where are fire incidents reported in Scott City, KS
Something went wrong! Please refresh the page.
|
| |||||||||||||||||||||||||||||||||||||||||||||||||||||||||||||||||||||||||||||||||||||||||||||||||||||||||||||
| Other | 202 | |||||||||||||||||||||||||||||||||||||||||||||||||||||||||||||||||||||||||||||||||||||||||||||||||||||||||||||
2002 - 2018 National Fire Incident Reporting System (NFIRS) incidents
- Incident types reported to NFIRS in Scott City, KS
- 43472.1%Fire
- 579.5%Rescue & EMS
- 508.3%Good Intent Call
- 284.7%Hazardous Condition
- 162.7%Service Call
- 142.3%False Alarm
- 20.3%Overpressure Rupture
- 10.2%Special Incident
- Fire incident types reported to NFIRS in Scott City, KS
- 27864.1%Outside Fires
- 8920.5%Mobile Property/Vehicle Fires
- 5913.6%Structure Fires
- 81.8%Other
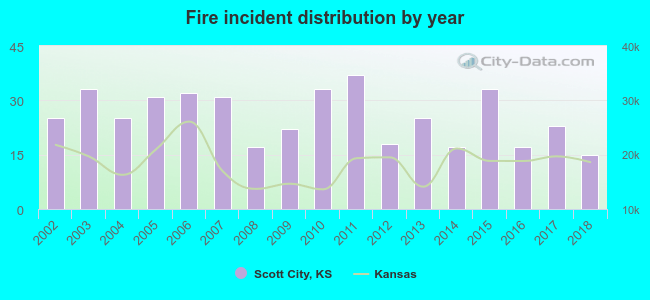 Based on the data from the years 2002 - 2018 the average number of fire incidents per year is 26. The highest number of reported fire incidents - 37 took place in 2011, and the least - 15 in 2018. The data has a decreasing trend.
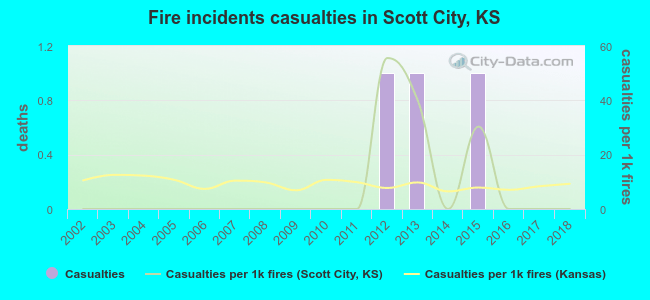 Based on the reports from the years 2002 - 2018 the average number of fire-related casualties per year is 0. The highest number of casualties - 1 took place in 2012, and the lowest - 0 in 2002. The data has a constant trend.
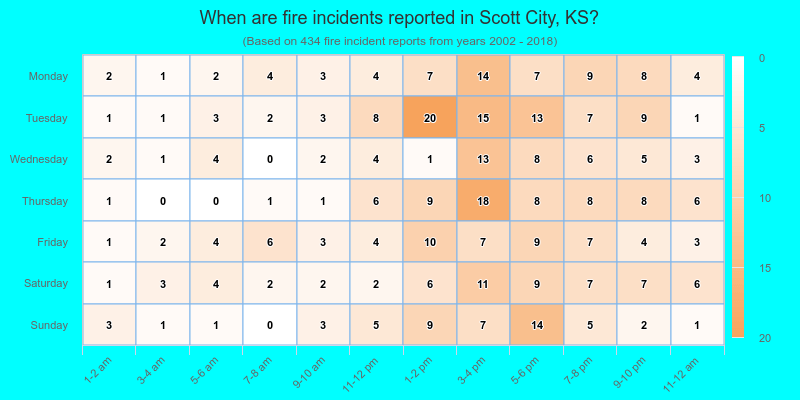
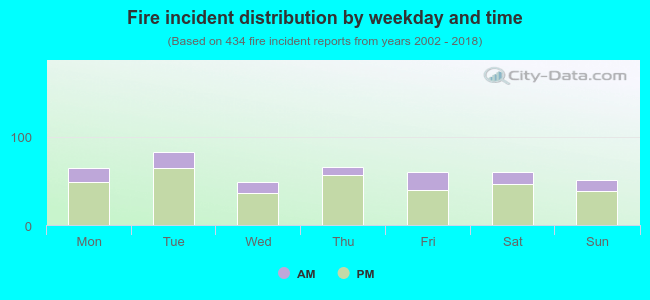 23.7% incidents where reported in the morning and 76.3% in the evening. The most fires (19.1%) took place on Tuesday, and the least (11.3%) on Wednesday.
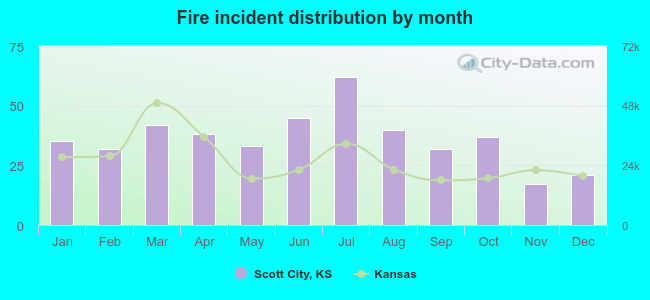 According to the 434 fires from years 2002 - 2018 most fires (14.3%) took place during July, and the least (3.9%) in November.
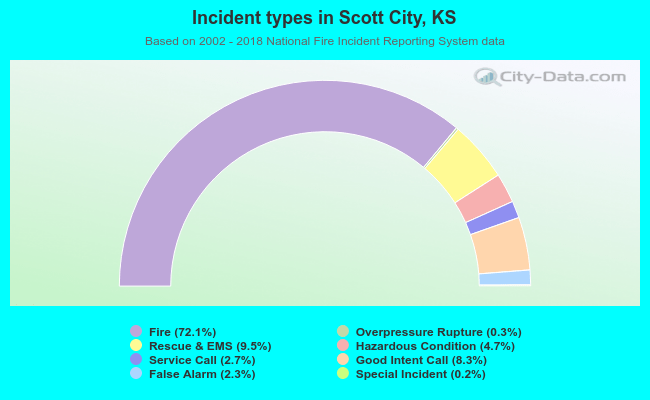 Out of all 602 cases reported during the years 2002 - 2018, the most belonged to the categories: Fire (72.1%), Rescue & EMS (9.5%), and Good Intent Call (8.3%).
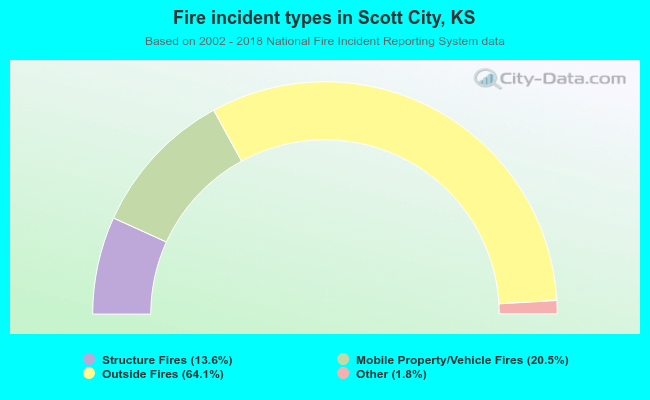 When looking into fire subcategories, the most incidents belonged to: Outside Fires (64.1%), and Mobile Property/Vehicle Fires (20.5%).