Scottsbluff: Fire Incidents, Nebraska (NE)
Where are fire incidents reported in Scottsbluff, NE
Something went wrong! Please refresh the page.
| Fire incidents reported | |
|---|---|
| Sreet name | Count |
| OVERLAND | 118 |
| 27TH ST | 106 |
| AVENUE I | 86 |
| AVENUE B | 72 |
| 19TH ST | 70 |
| 5TH AVE | 70 |
| 20TH ST | 64 |
| BROADWAY | 64 |
| 9TH AVE | 48 |
| 17TH ST | 44 |
| 10TH AVE | 42 |
| 1ST AVE | 42 |
| 2ND AVE | 42 |
| 8TH AVE | 42 |
| 9TH ST | 42 |
| 12TH ST | 38 |
| 17TH AVE | 38 |
| BELTLINE HWY | 38 |
| 15TH ST | 36 |
| 3RD AVE | 36 |
| 4TH AVE | 36 |
| 15TH AVE | 34 |
| 11TH AVE | 32 |
| 7TH AVE | 30 |
| AVENUE H | 30 |
| 16TH AVE | 28 |
| 12TH AVE | 24 |
| 42ND ST | 24 |
| 6TH AVE | 24 |
| 8TH ST | 24 |
| Other | 181 |
2002 - 2018 National Fire Incident Reporting System (NFIRS) incidents
- Incident types reported to NFIRS in Scottsbluff, NE
- 6,00538.8%Rescue & EMS
- 5,61936.3%Hazardous Condition
- 1,60510.4%Fire
- 9115.9%Good Intent Call
- 8795.7%Service Call
- 4232.7%False Alarm
- 220.1%Special Incident
- 180.1%Overpressure Rupture
- Fire incident types reported to NFIRS in Scottsbluff, NE
- 86453.8%Outside Fires
- 54934.2%Structure Fires
- 17210.7%Mobile Property/Vehicle Fires
- 201.2%Other
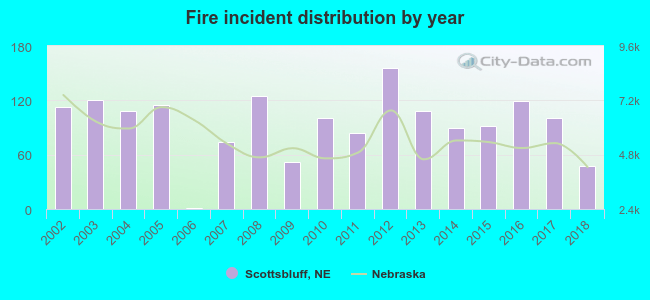 Based on the data from the years 2002 - 2018 the average number of fire incidents per year is 94. The highest number of fires - 156 took place in 2012, and the least - 1 in 2006. The data has a decreasing trend.
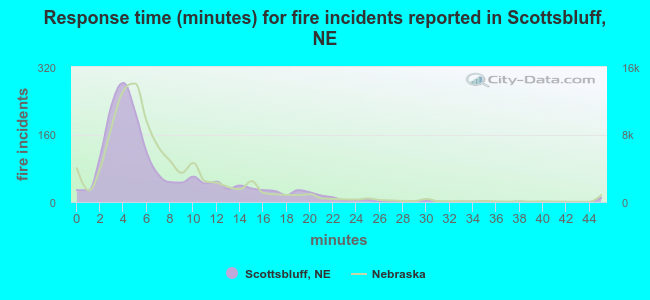 The median response time based on all reported fire incidents is 5 minutes. This is lower compared to the state median value.
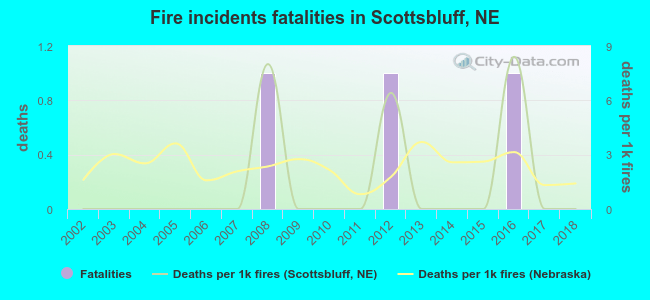 According to the reports from the years 2002 - 2018 the average number of fire-related yearly deaths is 0. The highest number of reported deaths - 1 took place in 2008, and the lowest - 0 in 2002. The data has a constant trend.
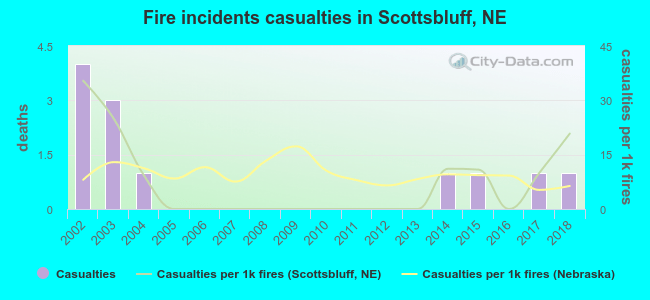 According to the reports from the years 2002 - 2018 the average number of fire-related casualties per year is 1. The highest number of reported injuries - 4 took place in 2002, and the lowest - 0 in 2005. The data has a declining trend.
The average number of injuries per 1,000 fire incidents is 7. This indicator was the highest - 35 in 2002, and the lowest 0 in 2005. The trend for injuries per 1,000 incidents is decreasing. Compared to the state value the number of injuries per 1,000 fires is lower.
According to the reports from the years 2002 - 2018 the average number of fire-related casualties per year is 1. The highest number of reported injuries - 4 took place in 2002, and the lowest - 0 in 2005. The data has a declining trend.
The average number of injuries per 1,000 fire incidents is 7. This indicator was the highest - 35 in 2002, and the lowest 0 in 2005. The trend for injuries per 1,000 incidents is decreasing. Compared to the state value the number of injuries per 1,000 fires is lower.
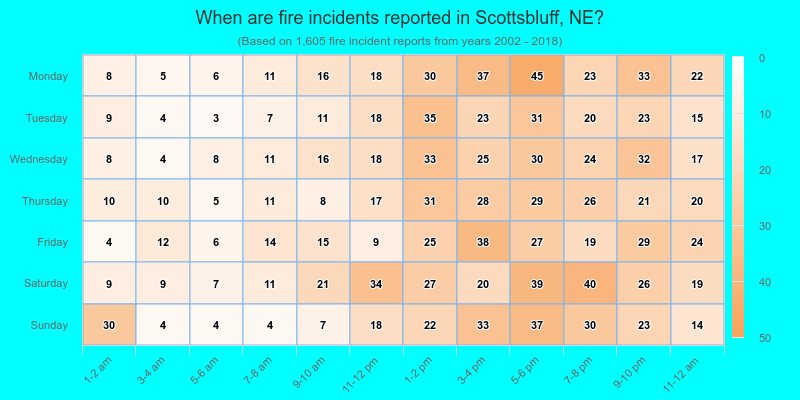
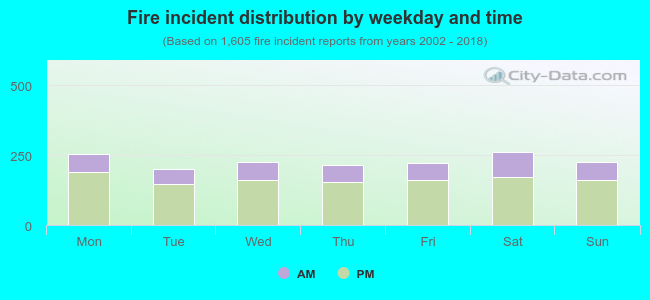 28.7% incidents where reported in the morning and 71.3% in the evening. The most fires (16.3%) took place on Saturday, and the least (12.4%) on Tuesday.
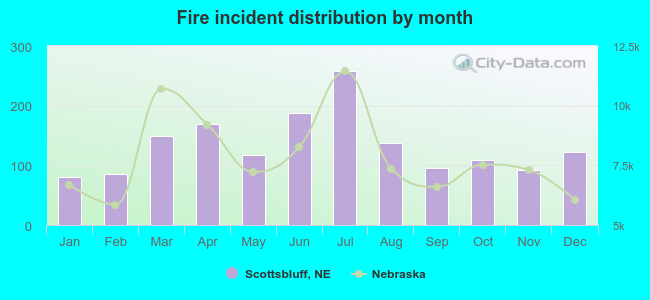 Based on the 1,605 fires from years 2002 - 2018 most fires (16.1%) took place during July, and the least (5.0%) in January.
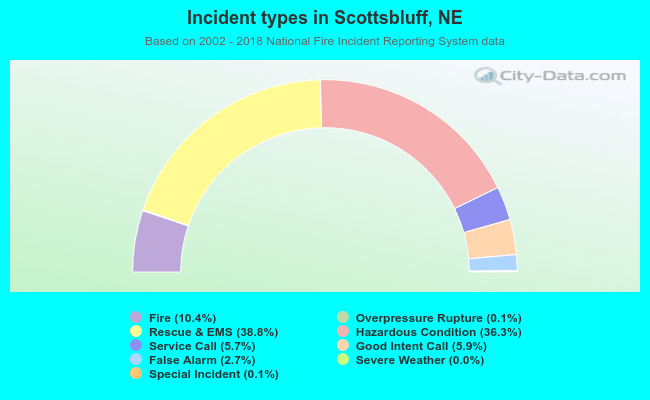 Out of all 15,485 cases reported during the years 2002 - 2018, the most belonged to the categories: Rescue & EMS (38.8%), Hazardous Condition (36.3%), and Fire (10.4%).
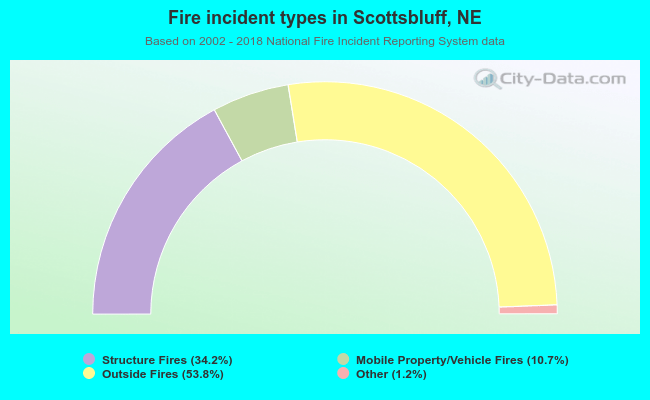 When looking into fire subcategories, the most incidents belonged to: Outside Fires (53.8%), and Structure Fires (34.2%).