| Fire incidents reported |
|---|
| Sreet name | Count |
|---|
| MISERY POINT RD | 20 | | PIONEER RD | 18 | | SEABECK HWY | 18 | | STAVIS BAY RD | 14 | | MIAMI BEACH RD | 10 | | SEABECK HOLLY RD | 10 | | PETER HAGEN RD | 8 | | GLORY LANE | 6 | | HOLLY RD | 6 | | LEWIS RD | 6 | | LONEROCK LANE | 6 | | NELLITA RD | 4 | | SEABECK HY | 4 | | SEAVIEW DR | 4 | | ADRIAN LANE | 2 | | ANTLER PL | 2 | | BIRDSEYE VIEW LOOP | 2 | | CAMP SUNDOWN | 2 | | CHURCH RD | 2 | | COHO RUN | 2 | | FRENDER LANE | 2 | | GOLD FINCH LN | 2 | | HITE CENTER RD | 2 | | HONEYHILL LOOP | 2 |
| | | Fire incidents reported |
|---|
| Sreet name | Count |
|---|
| JUNGLE CT | 2 | | KINGS WAY | 2 | | LAGOON DR | 2 | | LARSON LN | 2 | | LOST HIGHWAY WEST | 2 | | MEDOWOOD DR | 2 | | MINNIG LANE | 2 | | ONE MILE RD | 2 | | PRIDDY VISTA RD | 2 | | RHODA LANE | 2 | | ROCK QUARRY RD | 2 | | SCENIC BEACH RD | 2 | | SEABECK | 2 | | SEABECK HOLLY SE PETER HAGEN RD | 2 | | SEABECK HWY | 2 | | SEABECK RIDGE WAY | 2 | | SENIC BEACH RD | 2 | | STAVIS DRIVE WEST | 2 | | SUNSET | 2 | | SYMINGTON PKY | 2 | | TREE TOP LANE | 2 | | TURKO LN | 2 | | WAYNE RD | 2 | | WILDCAT LAKE RD | 2 |
|
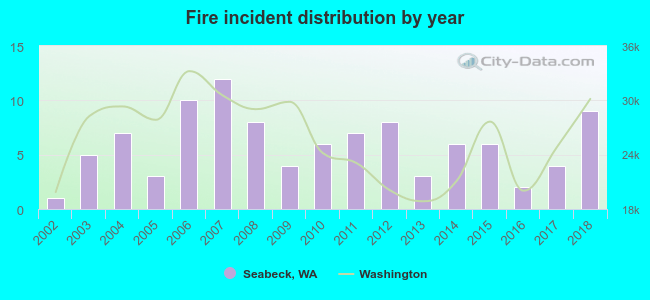 Based on the data from the years 2002 - 2018 the average number of fires per year is 6. The highest number of reported fires - 12 took place in 2007, and the least - 1 in 2002. The data has a rising trend.
 34.7% incidents where reported in the morning and 65.3% in the evening. The most fires (16.8%) took place on Monday, and the least (8.9%) on Friday.
 Based on the 101 incident reports from years 2002 - 2018 most fires (14.9%) took place during July, and the least (2.0%) in March.
 Out of all 1,004 cases reported during the years 2002 - 2018, the most belonged to the categories: Overpressure Rupture (41.2%), Service Call (16.5%), and Hazardous Condition (14.2%).
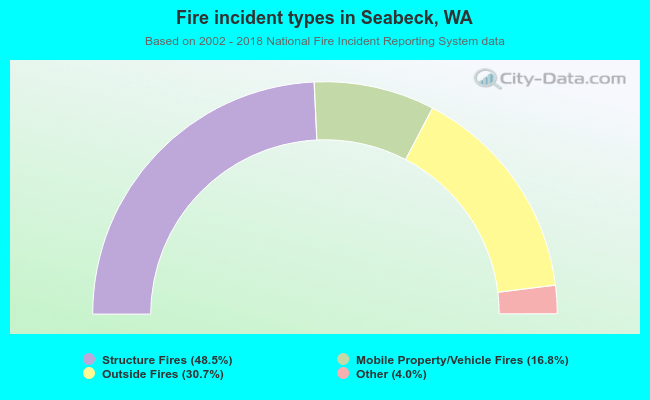 When looking into fire subcategories, the most incidents belonged to: Structure Fires (48.5%), and Outside Fires (30.7%).