| Fire incidents reported |
|---|
| Sreet name | Count |
|---|
| 201 I U WILLETS ROAD | 32 | | 49 WHITTIER DR | 16 | | 7 HILLDALE DR | 12 | | 109 URSULA DR | 8 | | 11 TULIP CT | 6 | | 161 DOGWOOD ROAD | 4 | | 180 DOGWOOD ROAD | 4 | | 4 DAWN LA | 4 | | 67 SERPENTINE LA | 4 | | DOGWOOD RD | 4 | | DOGWOOD ROAD | 4 | | I U WILLETS ROAD | 4 | | PEPPERMILL ROAD | 4 | | PIPER DR | 4 | | SEARINGTOWN ROAD | 4 | | SHELTER ROCK ROAD | 4 | | 1 BARRY PARK CT | 2 | | 1 HILLDALE DR | 2 | | 100 BIRCH HILL | 2 | | 101 SERPENTINE LA | 2 | | 131 SERPENTINE LA | 2 | | 149 DOGWOOD ROAD | 2 | | 16 URSULA DR | 2 | | 19 URSULA DR | 2 | | 193 DOGWOOD ROAD | 2 |
| | | Fire incidents reported |
|---|
| Sreet name | Count |
|---|
| 2 EDGEMERE DR | 2 | | 2 PIPER DR | 2 | | 20 CREST HOLLOW LA | 2 | | 211 DOGWOOD ROAD | 2 | | 22 W SUNSET ROAD | 2 | | 24 CRESCENT DR | 2 | | 25 WHEATLEY AVE | 2 | | 293 BIRCH DR | 2 | | 31 CREST HOLLOW LA | 2 | | 34 BARRY PARK CT | 2 | | 349 ELM DR | 2 | | 35 URSULA DR | 2 | | 376 ELM DR | 2 | | 38 EDGEMERE DR | 2 | | 383 ELM DR | 2 | | 40 PIPER DR | 2 | | 444 ELM DR | 2 | | 46 DOGWOOD ROAD | 2 | | 46 S SUNSET ROAD | 2 | | 6 WHITTIER DR | 2 | | 60 SEARINGTOWN ROAD | 2 | | 63 PARKVIEW DR | 2 | | 68 PARKVIEW DR | 2 | | 71 THE DELL | 2 | | 76 PARKVIEW DR | 2 |
|
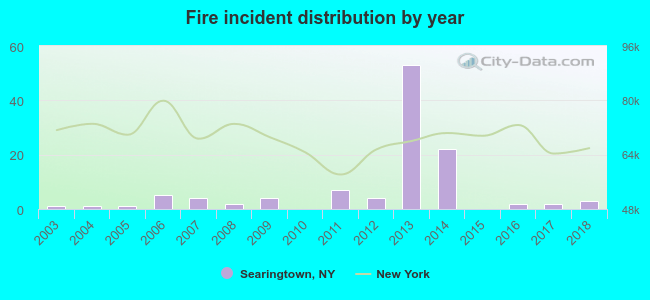 Based on the data from the years 2003 - 2018 the average number of fire incidents per year is 7. The highest number of reported fire incidents - 53 took place in 2013, and the least - 0 in 2010. The data has a growing trend.
 33.3% incidents where reported in the morning and 66.7% in the evening. The most fires (21.6%) took place on Tuesday, and the least (11.7%) on Wednesday.
 According to the 111 incident reports from years 2003 - 2018 most fires (13.5%) took place during June, and the least (5.4%) in February.
 Out of all 958 cases reported during the years 2003 - 2018, the most belonged to the categories: Rescue & EMS (43.1%), False Alarm (16.5%), and Service Call (12.3%).
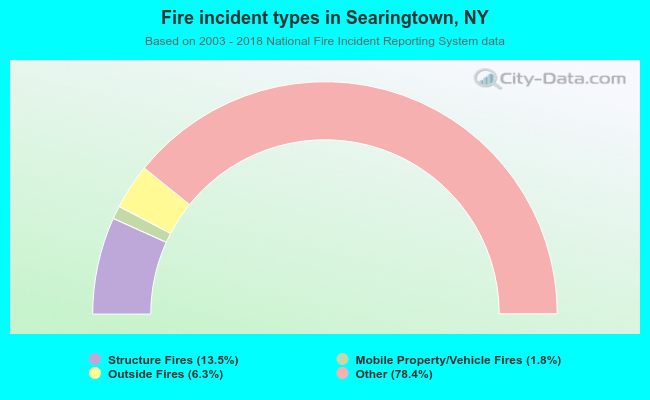 When looking into fire subcategories, the most incidents belonged to: Other (78.4%), and Structure Fires (13.5%).