Seaside Park: Fire Incidents, New Jersey (NJ)
Where are fire incidents reported in Seaside Park, NJ
Something went wrong! Please refresh the page.
|
| |||||||||||||||||||||||||||||||||||||||||||||||||||||||||||||||||||||||||||||||||||||||||||||||||||||||||||||
2004 - 2018 National Fire Incident Reporting System (NFIRS) incidents
- Incident types reported to NFIRS in Seaside Park, NJ
- 42364.3%Hazardous Condition
- 10816.4%Fire
- 558.4%False Alarm
- 345.2%Good Intent Call
- 203.0%Rescue & EMS
- 162.4%Service Call
- 10.2%Overpressure Rupture
- 10.2%Special Incident
- Fire incident types reported to NFIRS in Seaside Park, NJ
- 6055.6%Structure Fires
- 4037.0%Outside Fires
- 54.6%Other
- 32.8%Mobile Property/Vehicle Fires
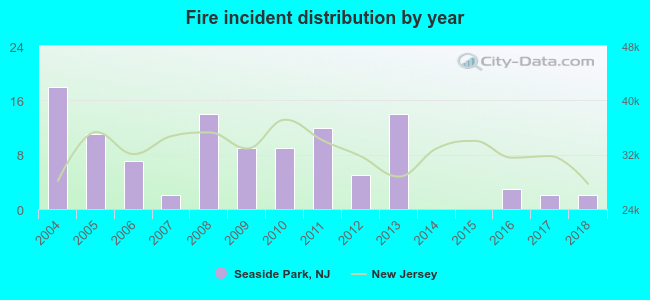 Based on the data from the years 2004 - 2018 the average number of fires per year is 7. The highest number of reported fires - 18 took place in 2004, and the least - 0 in 2014. The data has a decreasing trend.
 31.5% incidents where reported in the morning and 68.5% in the evening. The most fires (30.6%) took place on Thursday, and the least (6.5%) on Friday.
 Based on the 108 fire incident reports from years 2004 - 2018 most fires (19.4%) took place during June, and the least (0.9%) in February.
 Out of all 658 cases reported during the years 2004 - 2018, the most belonged to the categories: Hazardous Condition (64.3%), Fire (16.4%), and False Alarm (8.4%).
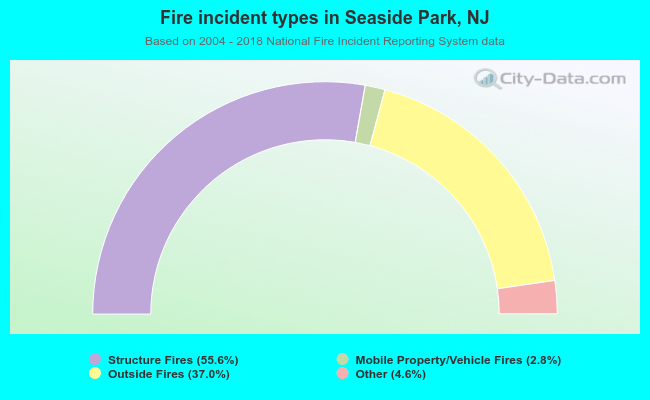 When looking into fire subcategories, the most reports belonged to: Structure Fires (55.6%), and Outside Fires (37.0%).