Sebring: Fire Incidents, Ohio (OH)
Where are fire incidents reported in Sebring, OH
Something went wrong! Please refresh the page.
|
| |||||||||||||||||||||||||||||||||||||||||||||||||||||||||||||||||||||||||||||||||||||||||||||||||||||||||||||
2002 - 2018 National Fire Incident Reporting System (NFIRS) incidents
- Incident types reported to NFIRS in Sebring, OH
- 2,08777.5%Rescue & EMS
- 2208.2%Fire
- 1435.3%Hazardous Condition
- 1214.5%Good Intent Call
- 732.7%Service Call
- 401.5%False Alarm
- 60.2%Overpressure Rupture
- Fire incident types reported to NFIRS in Sebring, OH
- 13460.9%Structure Fires
- 4721.4%Outside Fires
- 3415.5%Mobile Property/Vehicle Fires
- 52.3%Other
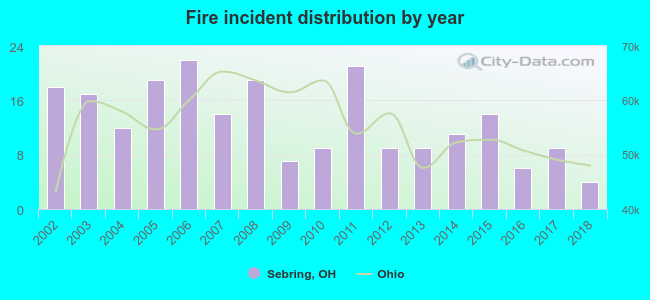 Based on the data from the years 2002 - 2018 the average number of fire incidents per year is 13. The highest number of fire incidents - 22 took place in 2006, and the least - 4 in 2018. The data has a declining trend.
 According to the reports from the years 2002 - 2018 the average number of fire-related yearly casualties is 1. The highest number of casualties - 4 took place in 2002, and the lowest - 0 in 2005. The data has a declining trend.
 26.8% incidents where reported in the morning and 73.2% in the evening. The most fires (21.4%) took place on Saturday, and the least (9.5%) on Tuesday.
 Based on the 220 fire incident reports from years 2002 - 2018 most fires (11.8%) took place during July, and the least (5.9%) in April.
 Out of all 2,692 cases reported during the years 2002 - 2018, the most belonged to the categories: Rescue & EMS (77.5%), Fire (8.2%), and Hazardous Condition (5.3%).
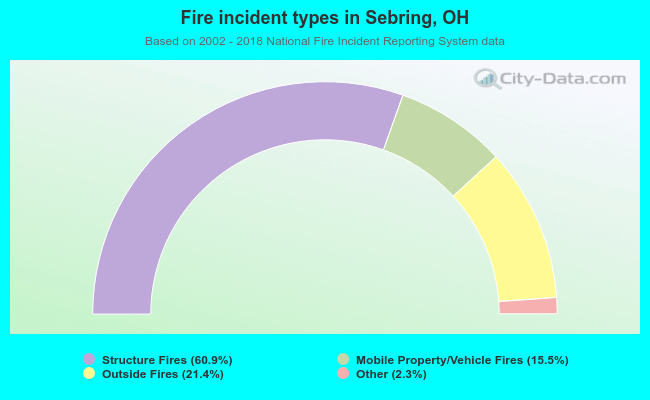 When looking into fire subcategories, the most incidents belonged to: Structure Fires (60.9%), and Outside Fires (21.4%).